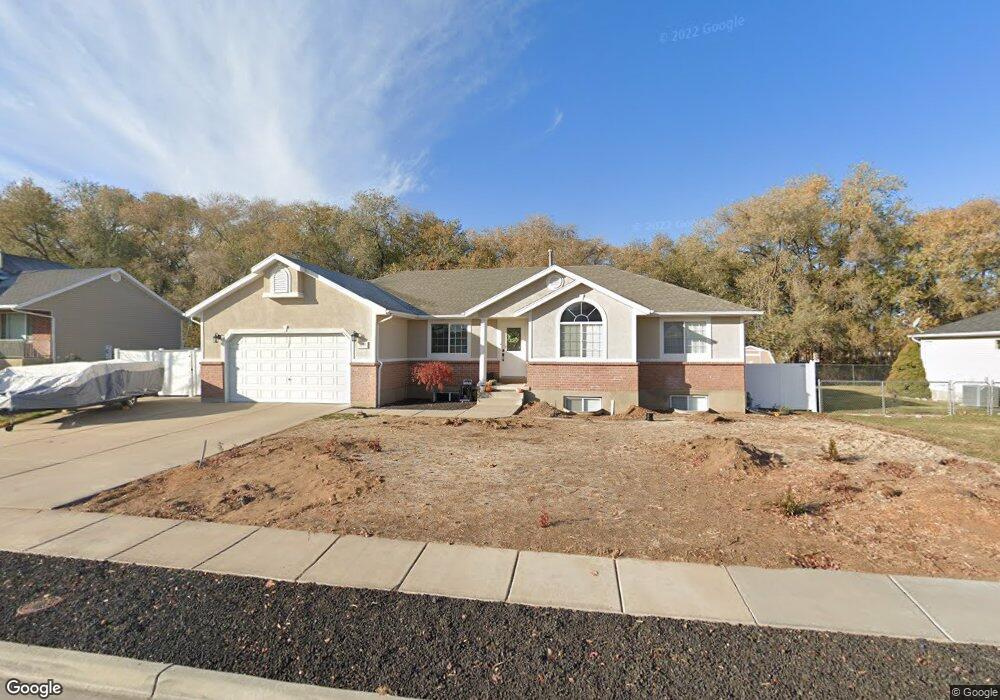
1037 N 900 W Clearfield, UT 84015
Estimated Value: $493,000 - $542,000
3
Beds
2
Baths
1,628
Sq Ft
$317/Sq Ft
Est. Value
About This Home
This home is located at 1037 N 900 W, Clearfield, UT 84015 and is currently estimated at $516,524, approximately $317 per square foot. 1037 N 900 W is a home located in Davis County with nearby schools including Clinton Elementary School, Sunset Junior High School, and Clearfield High School.
Ownership History
Date
Name
Owned For
Owner Type
Purchase Details
Closed on
Nov 3, 2020
Sold by
Barnes Bruce E and Barnes Jolynne F
Bought by
Law Stephen J and Law Lisa S
Current Estimated Value
Home Financials for this Owner
Home Financials are based on the most recent Mortgage that was taken out on this home.
Original Mortgage
$353,987
Outstanding Balance
$314,279
Interest Rate
2.8%
Mortgage Type
VA
Estimated Equity
$202,245
Purchase Details
Closed on
Dec 11, 1997
Sold by
Barnes Bruce E
Bought by
Barnes Bruce E and Barnes Jolynne F
Home Financials for this Owner
Home Financials are based on the most recent Mortgage that was taken out on this home.
Original Mortgage
$164,000
Interest Rate
7.19%
Purchase Details
Closed on
Apr 25, 1997
Sold by
Terra Firma Inc
Bought by
Barnes Bruce E
Home Financials for this Owner
Home Financials are based on the most recent Mortgage that was taken out on this home.
Original Mortgage
$140,800
Interest Rate
7.86%
Mortgage Type
Seller Take Back
Create a Home Valuation Report for This Property
The Home Valuation Report is an in-depth analysis detailing your home's value as well as a comparison with similar homes in the area
Home Values in the Area
Average Home Value in this Area
Purchase History
| Date | Buyer | Sale Price | Title Company |
|---|---|---|---|
| Law Stephen J | -- | Intermountain Titl | |
| Barnes Bruce E | -- | Equity Title Agency | |
| Barnes Bruce E | -- | Mountain View Title & Escrow |
Source: Public Records
Mortgage History
| Date | Status | Borrower | Loan Amount |
|---|---|---|---|
| Open | Law Stephen J | $353,987 | |
| Previous Owner | Barnes Bruce E | $164,000 | |
| Previous Owner | Barnes Bruce E | $140,800 |
Source: Public Records
Tax History Compared to Growth
Tax History
| Year | Tax Paid | Tax Assessment Tax Assessment Total Assessment is a certain percentage of the fair market value that is determined by local assessors to be the total taxable value of land and additions on the property. | Land | Improvement |
|---|---|---|---|---|
| 2025 | $2,906 | $279,400 | $95,402 | $183,998 |
| 2024 | $2,800 | $270,600 | $104,335 | $166,265 |
| 2023 | $2,661 | $476,000 | $119,641 | $356,359 |
| 2022 | $2,830 | $279,950 | $72,048 | $207,902 |
| 2021 | $2,541 | $373,000 | $92,123 | $280,877 |
| 2020 | $2,210 | $321,000 | $79,316 | $241,684 |
| 2019 | $2,114 | $300,000 | $90,770 | $209,230 |
| 2018 | $1,994 | $278,000 | $76,421 | $201,579 |
| 2016 | $1,915 | $137,830 | $29,973 | $107,857 |
| 2015 | $1,813 | $124,080 | $29,973 | $94,107 |
| 2014 | $1,727 | $120,073 | $29,973 | $90,100 |
| 2013 | -- | $113,552 | $27,143 | $86,409 |
Source: Public Records
Map
Nearby Homes