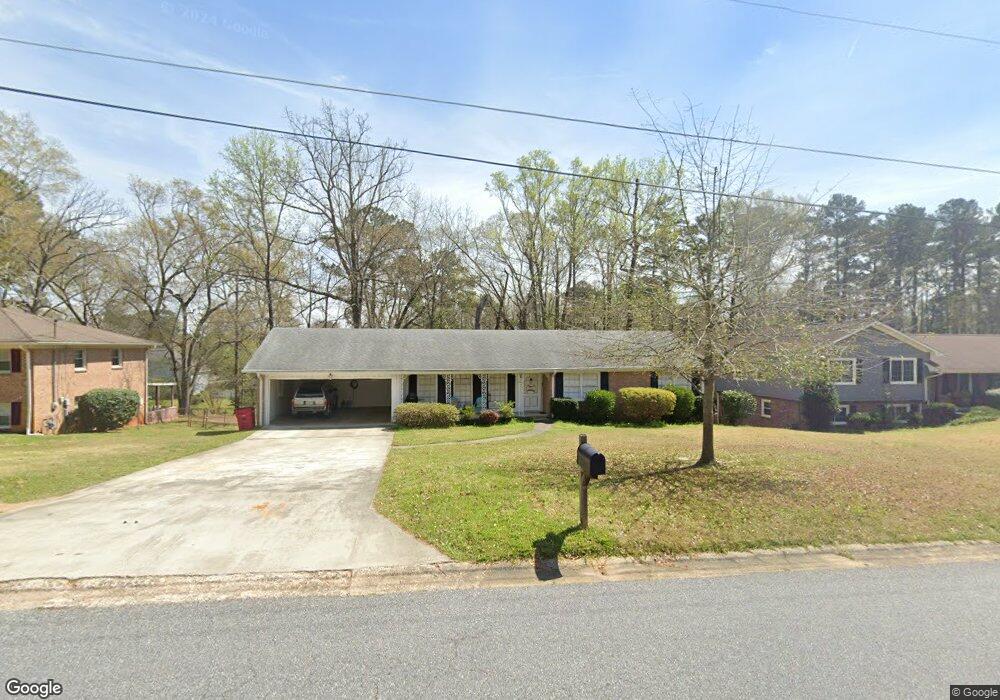
1037 Red Oak Dr Macon, GA 31204
Estimated Value: $175,592 - $238,000
3
Beds
2
Baths
3,017
Sq Ft
$65/Sq Ft
Est. Value
About This Home
This home is located at 1037 Red Oak Dr, Macon, GA 31204 and is currently estimated at $196,398, approximately $65 per square foot. 1037 Red Oak Dr is a home located in Bibb County with nearby schools including Rosa Taylor Elementary School, Howard Middle School, and Howard High School.
Ownership History
Date
Name
Owned For
Owner Type
Purchase Details
Closed on
Aug 25, 2017
Sold by
Turner Mitchell
Bought by
Turner Enterprises & Investments Llc
Current Estimated Value
Purchase Details
Closed on
Jul 28, 2017
Sold by
Cascade Investments Llc
Bought by
Turner Mitchell
Purchase Details
Closed on
Jul 13, 2017
Sold by
Rogers Amanda Brook and Bicht Jeffrey Edward
Bought by
Cascade Investments Llc
Purchase Details
Closed on
Mar 1, 2017
Sold by
Workman Cassandra L
Bought by
Rogers Amanda Brook Bicht
Purchase Details
Closed on
Jul 19, 2015
Sold by
Seguin Deborah Bicht
Bought by
Word Claudia Bicht
Purchase Details
Closed on
Sep 19, 2008
Sold by
Bicht Constance Claeren
Bought by
Bicht Jeffrey Edward and Deborah Cassandra Bicht
Purchase Details
Closed on
Jul 23, 2002
Sold by
Bicht Constance Claeren
Bought by
Bicht Constance C Life Est
Create a Home Valuation Report for This Property
The Home Valuation Report is an in-depth analysis detailing your home's value as well as a comparison with similar homes in the area
Home Values in the Area
Average Home Value in this Area
Purchase History
| Date | Buyer | Sale Price | Title Company |
|---|---|---|---|
| Turner Enterprises & Investments Llc | -- | None Available | |
| Turner Mitchell | $25,000 | None Available | |
| Cascade Investments Llc | -- | None Available | |
| Rogers Amanda Brook Bcht | $20,000 | None Available | |
| Rogers Amanda Brook Bicht | -- | -- | |
| Word Claudia Bicht | -- | None Available | |
| Bicht Jeffrey Edward | -- | None Available | |
| Bicht Constance C Life Est | -- | -- |
Source: Public Records
Tax History Compared to Growth
Tax History
| Year | Tax Paid | Tax Assessment Tax Assessment Total Assessment is a certain percentage of the fair market value that is determined by local assessors to be the total taxable value of land and additions on the property. | Land | Improvement |
|---|---|---|---|---|
| 2024 | $1,364 | $53,698 | $11,040 | $42,658 |
| 2023 | $1,528 | $51,582 | $11,040 | $40,542 |
| 2022 | $1,832 | $52,907 | $7,700 | $45,207 |
| 2021 | $1,889 | $49,701 | $7,700 | $42,001 |
| 2020 | $1,676 | $43,171 | $6,300 | $36,871 |
| 2019 | $1,489 | $38,041 | $6,300 | $31,741 |
| 2018 | $779 | $33,013 | $5,600 | $27,413 |
| 2017 | $945 | $32,224 | $6,254 | $25,970 |
| 2016 | $853 | $29,338 | $6,254 | $23,084 |
| 2015 | $1,710 | $41,908 | $7,035 | $34,872 |
| 2014 | $2,018 | $41,908 | $7,035 | $34,872 |
Source: Public Records
Map
Nearby Homes
- 1038 Red Oak Dr
- 1017 Clifton Dr
- 3185 Willowdale Dr
- 1250 Clairmont Place
- 3216 Willowdale Dr
- 3268 Misty Valley Dr
- 3280 Willowdale Dr
- 3077 Tiffin Cir
- 3272 Clairmont Ave
- 1074 N Pine Knoll Dr
- 3500 Northside Dr
- 782 Wimbish Rd
- 1246 Newport Rd
- 2811 Riverview Rd
- 3602 Northside Dr
- 3622 Northside Dr
- 3640 Northside Dr
- 2796 Ellenwood Cir N
- 1031 Red Oak Dr
- 1043 Red Oak Dr
- 1036 Clifton Dr
- 1025 Red Oak Dr
- 1051 Red Oak Dr
- 1040 Clifton Dr
- 1030 Clifton Dr
- 0 Clifton Dr Unit 7407224
- 0 Clifton Dr
- 1052 Clifton Dr
- 1032 Red Oak Dr
- 1044 Red Oak Dr
- 1024 Clifton Dr
- 1019 Red Oak Dr
- 1026 Red Oak Dr
- 1055 Red Oak Dr
- 1050 Red Oak Dr
- 1060 Clifton Dr
- 1018 Clifton Dr
- 1020 Red Oak Dr