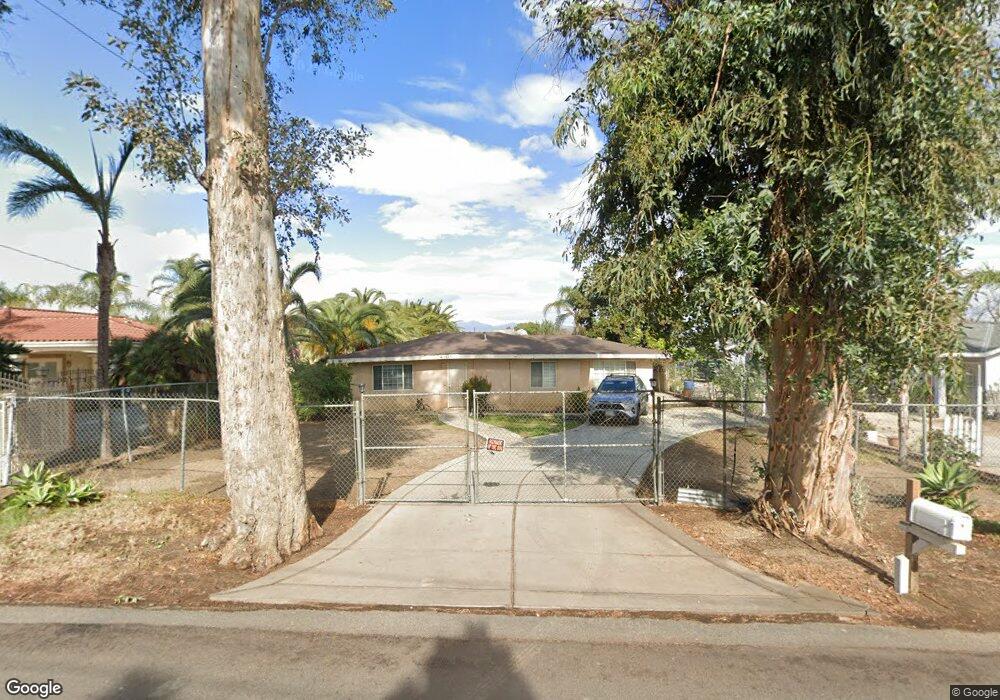
10371 56th St Mira Loma, CA 91752
Estimated Value: $468,000 - $657,000
3
Beds
1
Bath
1,056
Sq Ft
$541/Sq Ft
Est. Value
About This Home
This home is located at 10371 56th St, Mira Loma, CA 91752 and is currently estimated at $571,473, approximately $541 per square foot. 10371 56th St is a home located in Riverside County with nearby schools including Troth Street Elementary School, Mira Loma Middle School, and Jurupa Valley High School.
Ownership History
Date
Name
Owned For
Owner Type
Purchase Details
Closed on
Feb 19, 2002
Sold by
Lara Angeliana
Bought by
Lara Marco Antonio
Current Estimated Value
Home Financials for this Owner
Home Financials are based on the most recent Mortgage that was taken out on this home.
Original Mortgage
$110,500
Outstanding Balance
$44,850
Interest Rate
6.8%
Estimated Equity
$526,623
Purchase Details
Closed on
Sep 1, 1998
Sold by
Maverick Investment Llc
Bought by
Lara Marco Antonio
Home Financials for this Owner
Home Financials are based on the most recent Mortgage that was taken out on this home.
Original Mortgage
$86,271
Interest Rate
6.6%
Mortgage Type
FHA
Purchase Details
Closed on
May 19, 1998
Sold by
Hud
Bought by
Maverick Investments Llc
Purchase Details
Closed on
May 29, 1997
Sold by
Source One Mtg Services Corp
Bought by
Hud
Purchase Details
Closed on
Feb 7, 1997
Sold by
Kegerreis John
Bought by
Source One Mtg Services Corp
Create a Home Valuation Report for This Property
The Home Valuation Report is an in-depth analysis detailing your home's value as well as a comparison with similar homes in the area
Home Values in the Area
Average Home Value in this Area
Purchase History
| Date | Buyer | Sale Price | Title Company |
|---|---|---|---|
| Lara Marco Antonio | -- | Fidelity National Title | |
| Lara Marco Antonio | $86,500 | Orange Coast Title | |
| Lara Marco Antonio | -- | Orange Coast Title | |
| Maverick Investments Llc | $56,000 | Chicago Title Co | |
| Hud | -- | Chicago Title Insurance Co | |
| Source One Mtg Services Corp | $128,740 | Chicago Title |
Source: Public Records
Mortgage History
| Date | Status | Borrower | Loan Amount |
|---|---|---|---|
| Open | Lara Marco Antonio | $110,500 | |
| Previous Owner | Lara Marco Antonio | $86,271 |
Source: Public Records
Tax History Compared to Growth
Tax History
| Year | Tax Paid | Tax Assessment Tax Assessment Total Assessment is a certain percentage of the fair market value that is determined by local assessors to be the total taxable value of land and additions on the property. | Land | Improvement |
|---|---|---|---|---|
| 2025 | $1,308 | $127,890 | $55,951 | $71,939 |
| 2023 | $1,308 | $122,926 | $53,779 | $69,147 |
| 2022 | $1,283 | $120,517 | $52,725 | $67,792 |
| 2021 | $1,272 | $118,155 | $51,692 | $66,463 |
| 2020 | $1,260 | $116,944 | $51,162 | $65,782 |
| 2019 | $1,234 | $114,652 | $50,159 | $64,493 |
| 2018 | $1,193 | $112,405 | $49,176 | $63,229 |
| 2017 | $1,180 | $110,202 | $48,212 | $61,990 |
| 2016 | $1,162 | $108,042 | $47,267 | $60,775 |
| 2015 | $1,146 | $106,421 | $46,558 | $59,863 |
| 2014 | $1,067 | $104,339 | $45,647 | $58,692 |
Source: Public Records
Map
Nearby Homes
- 10538 54th St
- 10457 50th St
- 10517 50th St
- 6093 Troth St
- 9950 60th St
- 9745 55th St
- 5685 Ptolemy Way
- 5344 Lucretia Ave
- 4795 Bain St
- 11101 Gemini Ct
- 0 60th St Unit IV22125232
- 11187 58th St
- 4715 Bain St
- 4900 Eclipse Ave
- 9600 51st St
- 9798 Crossbay Loop Unit 2301
- 9798 Crossbay Loop Unit 2307
- 9798 Crossbay Loop Unit 2305
- 9798 Crossbay Loop Unit 2303
- 9792 Crossbay Loop Unit 2202