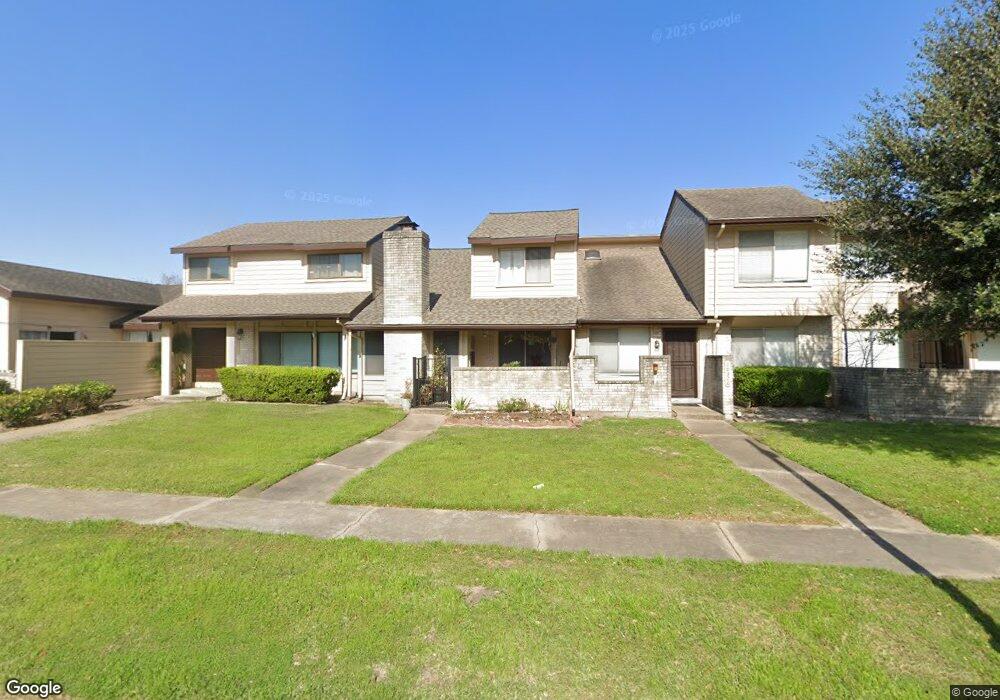
10372 Cook Rd Unit 153 Houston, TX 77099
Alief NeighborhoodEstimated Value: $156,620 - $183,000
2
Beds
3
Baths
1,328
Sq Ft
$125/Sq Ft
Est. Value
About This Home
This home is located at 10372 Cook Rd Unit 153, Houston, TX 77099 and is currently estimated at $165,655, approximately $124 per square foot. 10372 Cook Rd Unit 153 is a home located in Harris County with nearby schools including Kennedy Elementary School, Holub Middle School, and Mata Intermediate School.
Ownership History
Date
Name
Owned For
Owner Type
Purchase Details
Closed on
Jan 24, 2023
Sold by
Garcia Ramiro B and Garcia Annabelle F
Bought by
Cuico Constantino Million
Current Estimated Value
Purchase Details
Closed on
Aug 28, 2015
Sold by
Dosunmu Shamusi and Dosunmu Lamaydria
Bought by
Garcia Ramiro B
Home Financials for this Owner
Home Financials are based on the most recent Mortgage that was taken out on this home.
Original Mortgage
$71,250
Interest Rate
4.12%
Purchase Details
Closed on
Sep 28, 1999
Sold by
Green Margaret E and Dick Lynette M
Bought by
Dosunmu Shamusi
Home Financials for this Owner
Home Financials are based on the most recent Mortgage that was taken out on this home.
Original Mortgage
$40,410
Interest Rate
8.02%
Purchase Details
Closed on
Apr 15, 1994
Sold by
Mwamba Judith Ann and Mwamba Zuberi I
Bought by
Green Margaret E and Dick Lynette M
Create a Home Valuation Report for This Property
The Home Valuation Report is an in-depth analysis detailing your home's value as well as a comparison with similar homes in the area
Home Values in the Area
Average Home Value in this Area
Purchase History
| Date | Buyer | Sale Price | Title Company |
|---|---|---|---|
| Cuico Constantino Million | -- | Fidelity National Title | |
| Garcia Ramiro B | -- | None Available | |
| Dosunmu Shamusi | -- | First American Title | |
| Green Margaret E | -- | Title Agency #91 |
Source: Public Records
Mortgage History
| Date | Status | Borrower | Loan Amount |
|---|---|---|---|
| Previous Owner | Garcia Ramiro B | $71,250 | |
| Previous Owner | Dosunmu Shamusi | $40,410 |
Source: Public Records
Tax History Compared to Growth
Tax History
| Year | Tax Paid | Tax Assessment Tax Assessment Total Assessment is a certain percentage of the fair market value that is determined by local assessors to be the total taxable value of land and additions on the property. | Land | Improvement |
|---|---|---|---|---|
| 2025 | $3,404 | $139,309 | $27,375 | $111,934 |
| 2024 | $3,404 | $149,861 | $27,375 | $122,486 |
| 2023 | $3,404 | $149,861 | $27,375 | $122,486 |
| 2022 | $2,869 | $123,365 | $27,375 | $95,990 |
| 2021 | $2,746 | $112,512 | $27,375 | $85,137 |
| 2020 | $2,620 | $103,637 | $27,375 | $76,262 |
| 2019 | $2,499 | $94,165 | $27,375 | $66,790 |
| 2018 | $844 | $88,489 | $27,375 | $61,114 |
| 2017 | $2,373 | $90,352 | $17,167 | $73,185 |
| 2016 | $2,010 | $76,530 | $14,541 | $61,989 |
| 2015 | $1,468 | $76,530 | $14,541 | $61,989 |
| 2014 | $1,468 | $55,316 | $10,510 | $44,806 |
Source: Public Records
Map
Nearby Homes
- 10366 Panther Point Dr
- 10355 Panther Point Dr
- 10327 Panther Point Dr
- 10362 Cook Rd Unit 187
- 12510 Panther Place Dr
- 12166 Huntington Venture Dr
- 12623 S Dairy Ashford Rd
- 12419 Longbrook Dr
- 10325 Huntington Place Dr Unit 325
- 10327 Huntington Place Dr Unit 327
- 10530 Farmingham Dr
- 10602 Tenneta Dr
- 10518 Huntington Dale Dr
- 10534 Huntington Wood Dr
- 12122 Plumbrook Dr
- 12123 Plumpoint Dr
- 12346 Huntington Venture Dr
- 11406 Caesar Dr
- 12431 Huntington Field Dr
- 12054 Green Glade Dr
- 10372 Cook Rd Unit 372
- 10374 Cook Rd Unit 374
- 10374 Cook Rd Unit 152
- 10370 Cook Rd Unit 370
- 10368 Cook Rd
- 10368 Cook Rd Unit 155
- 10376 Cook Rd Unit 376
- 10376 Cook Rd Unit 151
- 10366 Cook Rd Unit 366
- 10364 Cook Rd Unit 364
- 10388 Cook Rd Unit 388
- 10388 Cook Rd Unit 146
- 10386 Cook Rd Unit 386
- 10384 Cook Rd Unit 6384
- 10384 Cook Rd Unit 144
- 12489 S Dry Ashfrd St Unit 2489
- 10382 Cook Rd Unit 382
- 10382 Cook Rd Unit 143
- 10390 Cook Rd Unit 390
- 10390 Cook Rd Unit 147