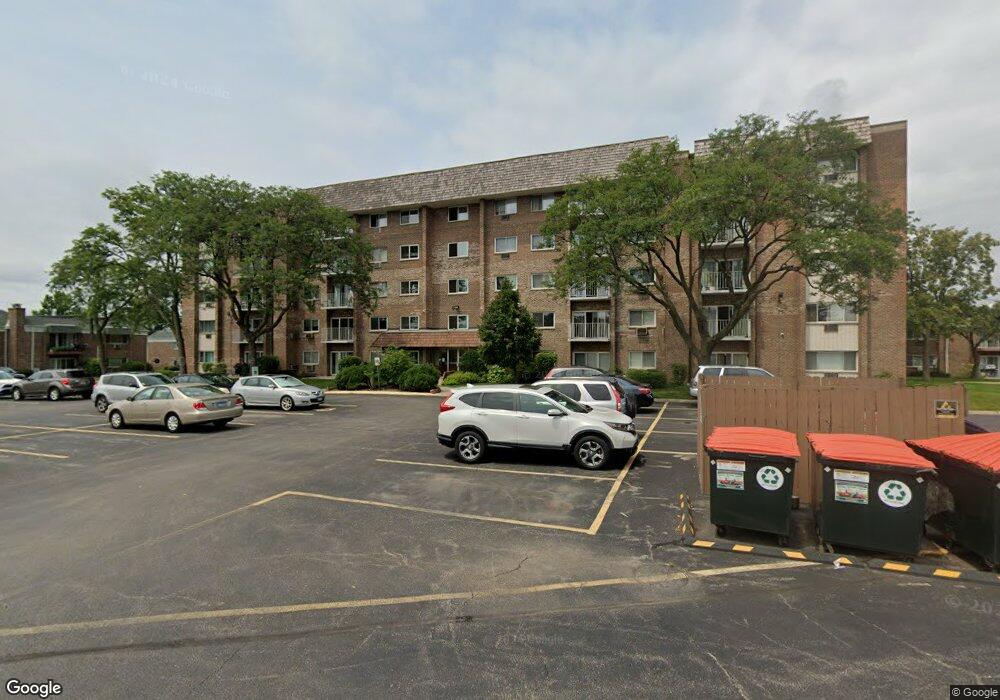
10373 Dearlove Rd Unit 6502 Glenview, IL 60025
Estimated Value: $173,000 - $224,000
1
Bed
--
Bath
57,990
Sq Ft
$3/Sq Ft
Est. Value
About This Home
This home is located at 10373 Dearlove Rd Unit 6502, Glenview, IL 60025 and is currently estimated at $189,928, approximately $3 per square foot. 10373 Dearlove Rd Unit 6502 is a home located in Cook County with nearby schools including Westbrook Elementary School, Glen Grove Elementary School, and Springman Middle School.
Ownership History
Date
Name
Owned For
Owner Type
Purchase Details
Closed on
Feb 28, 2017
Sold by
Babiak Gregory P and Babiak Agnieszka
Bought by
Kogan Natalia
Current Estimated Value
Purchase Details
Closed on
Aug 28, 2003
Sold by
Mielcarek Artur and Mielcarek Arthur
Bought by
Babiak Gregory P
Home Financials for this Owner
Home Financials are based on the most recent Mortgage that was taken out on this home.
Original Mortgage
$110,500
Interest Rate
5.84%
Mortgage Type
Purchase Money Mortgage
Purchase Details
Closed on
Apr 20, 2000
Sold by
Katsiamakis Peter and Katsiamakis Pandelis P
Bought by
Mielcarek Arthur
Home Financials for this Owner
Home Financials are based on the most recent Mortgage that was taken out on this home.
Original Mortgage
$80,100
Interest Rate
7.62%
Create a Home Valuation Report for This Property
The Home Valuation Report is an in-depth analysis detailing your home's value as well as a comparison with similar homes in the area
Home Values in the Area
Average Home Value in this Area
Purchase History
| Date | Buyer | Sale Price | Title Company |
|---|---|---|---|
| Kogan Natalia | $113,500 | Attorneys Title Guaranty Fun | |
| Babiak Gregory P | $145,000 | Chicago Title Insurance Comp | |
| Mielcarek Arthur | $89,000 | 1St American Title |
Source: Public Records
Mortgage History
| Date | Status | Borrower | Loan Amount |
|---|---|---|---|
| Previous Owner | Babiak Gregory P | $110,500 | |
| Previous Owner | Mielcarek Arthur | $80,100 | |
| Closed | Babiak Gregory P | $20,000 |
Source: Public Records
Tax History Compared to Growth
Tax History
| Year | Tax Paid | Tax Assessment Tax Assessment Total Assessment is a certain percentage of the fair market value that is determined by local assessors to be the total taxable value of land and additions on the property. | Land | Improvement |
|---|---|---|---|---|
| 2024 | $2,863 | $12,169 | $363 | $11,806 |
| 2023 | $2,700 | $12,169 | $363 | $11,806 |
| 2022 | $2,700 | $12,169 | $363 | $11,806 |
| 2021 | $2,672 | $10,330 | $247 | $10,083 |
| 2020 | $2,656 | $10,330 | $247 | $10,083 |
| 2019 | $2,487 | $11,450 | $247 | $11,203 |
| 2018 | $1,853 | $7,637 | $214 | $7,423 |
| 2017 | $1,005 | $7,637 | $214 | $7,423 |
| 2016 | $1,142 | $7,637 | $214 | $7,423 |
| 2015 | $730 | $5,559 | $173 | $5,386 |
| 2014 | $727 | $5,559 | $173 | $5,386 |
| 2013 | $692 | $5,559 | $173 | $5,386 |
Source: Public Records
Map
Nearby Homes
- 10385 Dearlove Rd Unit 1I
- 4150 Central Rd Unit 3E
- 625 Quincy Bridge Ln Unit 301
- 701 Forum Square Unit 609
- 10347 Dearlove Rd Unit 302
- 600 Naples Ct Unit 510
- 600 Naples Ct Unit 107
- 600 Naples Ct Unit 608
- 4170 Cove Ln Unit 2B
- 3732 Capri Ct Unit T18A
- 9517 W Central Rd
- 917 Tamer Ln
- 1018 Castilian Ct Unit A205
- 9411 Harrison St Unit 471494
- 4004 Denice Ct Unit 3
- 1026 Castilian Ct Unit D162
- 10009 Meadow Ln
- 533 Cherry Ln
- 3505 Linneman St
- 518 Elder Ln
- 10373 Dearlove Rd Unit 3G
- 10373 Dearlove Rd Unit 5F
- 10373 Dearlove Rd Unit 3B
- 10373 Dearlove Rd Unit 4D
- 10373 Dearlove Rd Unit 5H
- 10373 Dearlove Rd Unit 5C
- 10373 Dearlove Rd Unit 6109
- 10373 Dearlove Rd Unit 6509
- 10373 Dearlove Rd Unit 6407
- 10373 Dearlove Rd Unit 6203
- 10373 Dearlove Rd Unit 6107
- 10373 Dearlove Rd Unit 6101
- 10373 Dearlove Rd Unit 6402
- 10373 Dearlove Rd Unit 6505
- 10373 Dearlove Rd Unit 6102
- 10373 Dearlove Rd Unit 6409
- 10373 Dearlove Rd Unit 6103
- 10373 Dearlove Rd Unit 6408
- 10373 Dearlove Rd Unit 6501
- 10373 Dearlove Rd Unit 6305