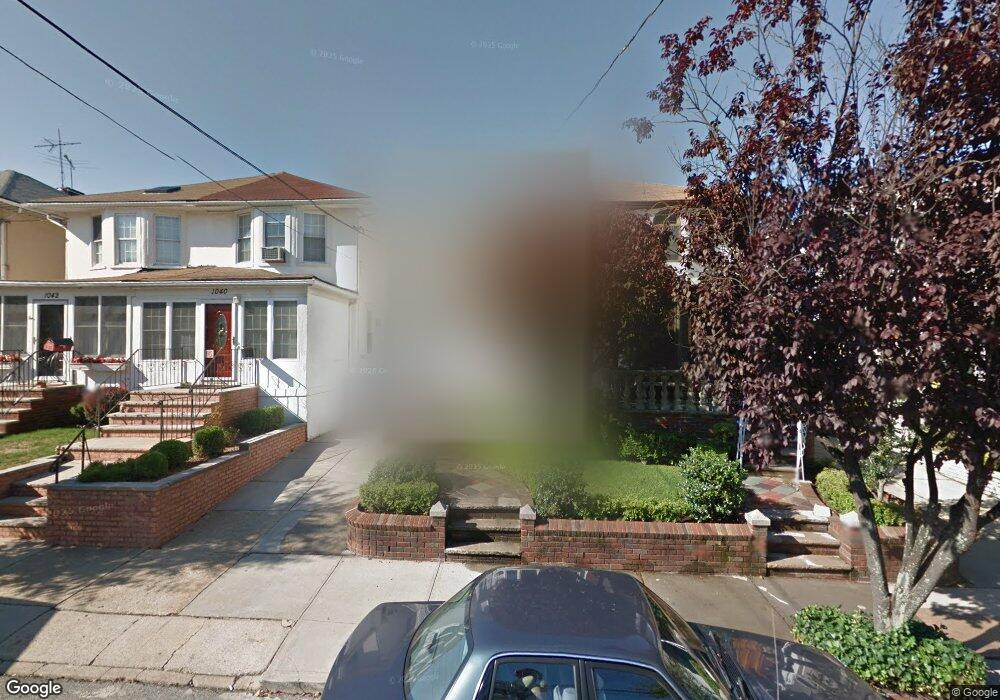
1038 80th St Unit Building Brooklyn, NY 11228
Dyker Heights NeighborhoodEstimated Value: $1,054,000 - $1,220,000
Studio
--
Bath
1,328
Sq Ft
$848/Sq Ft
Est. Value
About This Home
This home is located at 1038 80th St Unit Building, Brooklyn, NY 11228 and is currently estimated at $1,126,361, approximately $848 per square foot. 1038 80th St Unit Building is a home located in Kings County with nearby schools including P.S. 127 McKinley Park, IS 201 Madeleine Brennan Intermediate School, and Fort Hamilton High School.
Ownership History
Date
Name
Owned For
Owner Type
Purchase Details
Closed on
Aug 13, 2021
Sold by
Betzag Michael L and Betzag Betzag
Bought by
Jiang Wen Fang and Wang Da Wen
Current Estimated Value
Home Financials for this Owner
Home Financials are based on the most recent Mortgage that was taken out on this home.
Original Mortgage
$658,000
Outstanding Balance
$597,424
Interest Rate
2.8%
Mortgage Type
Purchase Money Mortgage
Estimated Equity
$528,937
Purchase Details
Closed on
Jan 9, 2009
Sold by
Betzag Michael J and Betzag Patricia L
Bought by
Betzag Michael L and Betzag Todd J
Create a Home Valuation Report for This Property
The Home Valuation Report is an in-depth analysis detailing your home's value as well as a comparison with similar homes in the area
Home Values in the Area
Average Home Value in this Area
Purchase History
| Date | Buyer | Sale Price | Title Company |
|---|---|---|---|
| Jiang Wen Fang | $940,000 | -- | |
| Betzag Michael L | -- | -- |
Source: Public Records
Mortgage History
| Date | Status | Borrower | Loan Amount |
|---|---|---|---|
| Open | Jiang Wen Fang | $658,000 |
Source: Public Records
Tax History
| Year | Tax Paid | Tax Assessment Tax Assessment Total Assessment is a certain percentage of the fair market value that is determined by local assessors to be the total taxable value of land and additions on the property. | Land | Improvement |
|---|---|---|---|---|
| 2025 | $7,944 | $59,460 | $17,520 | $41,940 |
| 2024 | $7,944 | $62,640 | $17,520 | $45,120 |
| 2023 | $7,596 | $65,820 | $17,520 | $48,300 |
| 2022 | $7,124 | $56,400 | $17,520 | $38,880 |
| 2021 | $6,542 | $59,040 | $17,520 | $41,520 |
| 2020 | $3,250 | $49,140 | $17,520 | $31,620 |
| 2019 | $6,293 | $49,140 | $17,520 | $31,620 |
| 2018 | $5,767 | $31,170 | $10,474 | $20,696 |
| 2017 | $5,710 | $29,738 | $10,109 | $19,629 |
| 2016 | $5,308 | $28,305 | $10,318 | $17,987 |
| 2015 | $3,199 | $28,290 | $14,211 | $14,079 |
| 2014 | $3,199 | $27,469 | $12,678 | $14,791 |
Source: Public Records
Map
Nearby Homes
Your Personal Tour Guide
Ask me questions while you tour the home.