Estimated Value: $357,000 - $575,000
3
Beds
4
Baths
1,703
Sq Ft
$301/Sq Ft
Est. Value
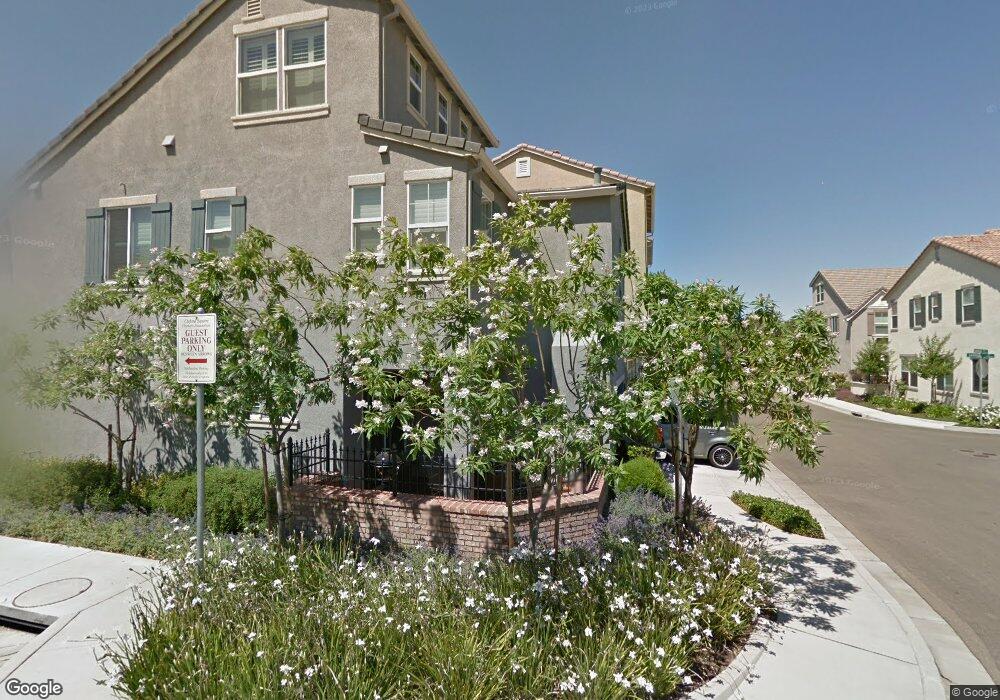
About This Home
This home is located at 1038 Abingdon Way, Tracy, CA 95376 and is currently estimated at $512,528, approximately $300 per square foot. 1038 Abingdon Way is a home located in San Joaquin County with nearby schools including Wanda Hirsch Elementary School, Earle E. Williams Middle School, and John C. Kimball High School.
Ownership History
Date
Name
Owned For
Owner Type
Purchase Details
Closed on
Nov 25, 2022
Sold by
Iulia Rita Robinson Trust and Robinson Rita Iulia
Bought by
Robinson Iulia Rita
Current Estimated Value
Purchase Details
Closed on
Apr 28, 2022
Sold by
Rita Robinson Iulia
Bought by
Lulia Rita Robinson Trust
Purchase Details
Closed on
Feb 8, 2022
Sold by
Robinson Iulia R
Bought by
Robinson Iulia R
Home Financials for this Owner
Home Financials are based on the most recent Mortgage that was taken out on this home.
Original Mortgage
$450,000
Interest Rate
3.55%
Mortgage Type
New Conventional
Purchase Details
Closed on
Dec 18, 2008
Sold by
Cardenas Jonathan
Bought by
Cardenas Iulia R
Home Financials for this Owner
Home Financials are based on the most recent Mortgage that was taken out on this home.
Original Mortgage
$267,401
Interest Rate
6.1%
Mortgage Type
FHA
Purchase Details
Closed on
Dec 5, 2008
Sold by
Standard Pacific Corporation
Bought by
Cardenas Iulia R
Home Financials for this Owner
Home Financials are based on the most recent Mortgage that was taken out on this home.
Original Mortgage
$267,401
Interest Rate
6.1%
Mortgage Type
FHA
Create a Home Valuation Report for This Property
The Home Valuation Report is an in-depth analysis detailing your home's value as well as a comparison with similar homes in the area
Home Values in the Area
Average Home Value in this Area
Purchase History
We collect this data history from publicly available records. To have your information removed, we recommend requesting removal directly through your county’s website.
| Date | Buyer | Sale Price | Title Company |
|---|---|---|---|
| Robinson Iulia Rita | -- | None Listed On Document | |
| Lulia Rita Robinson Trust | -- | -- | |
| Robinson Iulia R | -- | Rosenberg Lpa Llc | |
| Cardenas Iulia R | -- | Old Republic Title Company | |
| Cardenas Iulia R | $272,500 | Old Republic Title Company |
Source: Public Records
Mortgage History
We collect this data history from publicly available records. To have your information removed, we recommend requesting removal directly through your county’s website.
| Date | Status | Borrower | Loan Amount |
|---|---|---|---|
| Previous Owner | Robinson Iulia R | $450,000 | |
| Previous Owner | Cardenas Iulia R | $267,401 |
Source: Public Records
Tax History
| Year | Tax Paid | Tax Assessment Tax Assessment Total Assessment is a certain percentage of the fair market value that is determined by local assessors to be the total taxable value of land and additions on the property. | Land | Improvement |
|---|---|---|---|---|
| 2025 | $4,226 | $350,625 | $104,303 | $246,322 |
| 2024 | $3,903 | $343,751 | $102,258 | $241,493 |
| 2023 | $3,840 | $337,011 | $100,253 | $236,758 |
| 2022 | $3,760 | $330,404 | $98,288 | $232,116 |
| 2021 | $3,714 | $323,926 | $96,361 | $227,565 |
| 2020 | $3,688 | $320,605 | $95,373 | $225,232 |
| 2019 | $3,628 | $314,319 | $93,503 | $220,816 |
| 2018 | $3,808 | $308,157 | $91,670 | $216,487 |
| 2017 | $3,632 | $302,116 | $89,873 | $212,243 |
| 2016 | $3,664 | $296,193 | $88,111 | $208,082 |
| 2014 | $3,455 | $286,034 | $85,089 | $200,945 |
Source: Public Records
Map
Nearby Homes
- 1121 Andreas Ln
- 2053 Raven St
- 1930 Tahoe Cir
- 2040 Iberis Ct
- 1826 Pelican Ct
- 1445 Yorkshire Loop
- 1703 Egret Dr
- 1331 Claremont Dr
- 1670 Tahoe Cir
- 11378 Mountain View Rd
- 1170 Cornucopia Place
- 1582 Ivy Ln
- 1110 Plymouth Dr
- 1091 Plymouth Dr
- 1061 Plymouth Dr
- 635 Menay Dr
- 1710 Flora Way
- 131 W Central Ave
- 1561 Granite Place
- 1585 Granite Place
- 1058 Abingdon Way
- 1018 Abingdon Way
- 1047 Sallie Ln
- 1078 Abingdon Way
- 1027 Sallie Ln
- 1087 Sallie Ln
- 2091 Garrison Ln
- 2090 Garrison Ln
- 1036 Sallie Ln
- 2092 Savage Ln
- 1056 Sallie Ln
- 2081 Garrison Ln
- 2099 Mcalister Ln
- 2080 Garrison Ln
- 2118 Wellington Dr
- 2128 Wellington Dr
- 1076 Sallie Ln
- 2138 Wellington Dr
- 1127 Rosette Ln
- 2082 Savage Ln
Your Personal Tour Guide
Ask me questions while you tour the home.