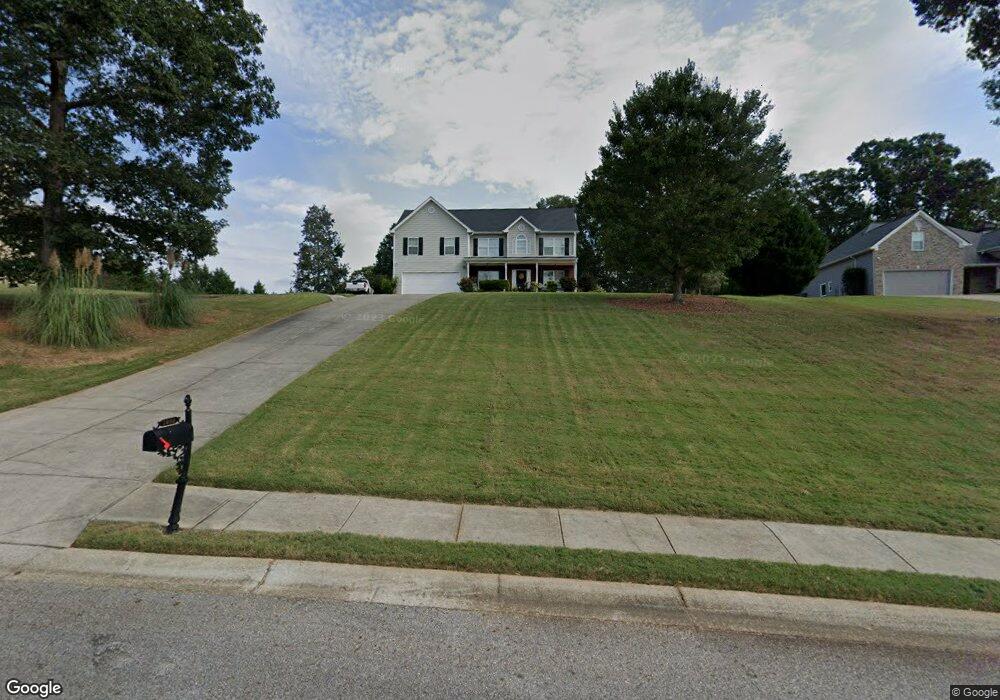
1038 Denali Way Winder, GA 30680
Estimated Value: $384,713 - $435,000
--
Bed
3
Baths
2,697
Sq Ft
$154/Sq Ft
Est. Value
About This Home
This home is located at 1038 Denali Way, Winder, GA 30680 and is currently estimated at $415,678, approximately $154 per square foot. 1038 Denali Way is a home located in Barrow County with nearby schools including Bramlett Elementary School, Russell Middle School, and Winder-Barrow High School.
Ownership History
Date
Name
Owned For
Owner Type
Purchase Details
Closed on
Jan 20, 2005
Sold by
Elmo Fortenberry Builder
Bought by
Tarver Christopher E and Tarver Lisa
Current Estimated Value
Home Financials for this Owner
Home Financials are based on the most recent Mortgage that was taken out on this home.
Original Mortgage
$145,520
Outstanding Balance
$79,449
Interest Rate
7%
Mortgage Type
New Conventional
Estimated Equity
$336,229
Purchase Details
Closed on
Sep 21, 2004
Sold by
Hkb Inc
Bought by
Elmo Fortenberry Builder Inc
Home Financials for this Owner
Home Financials are based on the most recent Mortgage that was taken out on this home.
Original Mortgage
$134,925
Interest Rate
5.78%
Purchase Details
Closed on
Aug 15, 2001
Bought by
Hkb Inc
Create a Home Valuation Report for This Property
The Home Valuation Report is an in-depth analysis detailing your home's value as well as a comparison with similar homes in the area
Home Values in the Area
Average Home Value in this Area
Purchase History
| Date | Buyer | Sale Price | Title Company |
|---|---|---|---|
| Tarver Christopher E | $181,900 | -- | |
| Elmo Fortenberry Builder Inc | $38,500 | -- | |
| Hkb Inc | -- | -- |
Source: Public Records
Mortgage History
| Date | Status | Borrower | Loan Amount |
|---|---|---|---|
| Open | Tarver Christopher E | $145,520 | |
| Previous Owner | Elmo Fortenberry Builder Inc | $134,925 |
Source: Public Records
Tax History Compared to Growth
Tax History
| Year | Tax Paid | Tax Assessment Tax Assessment Total Assessment is a certain percentage of the fair market value that is determined by local assessors to be the total taxable value of land and additions on the property. | Land | Improvement |
|---|---|---|---|---|
| 2024 | $3,022 | $122,233 | $28,000 | $94,233 |
| 2023 | $2,625 | $123,033 | $28,000 | $95,033 |
| 2022 | $3,289 | $115,711 | $26,000 | $89,711 |
| 2021 | $2,742 | $91,129 | $19,200 | $71,929 |
| 2020 | $2,624 | $87,129 | $15,200 | $71,929 |
| 2019 | $2,579 | $84,165 | $15,200 | $68,965 |
| 2018 | $2,290 | $75,559 | $15,200 | $60,359 |
| 2017 | $2,037 | $69,945 | $17,000 | $52,945 |
| 2016 | $1,946 | $65,509 | $17,000 | $48,509 |
| 2015 | $1,971 | $66,039 | $17,000 | $49,039 |
| 2014 | $1,767 | $58,389 | $8,820 | $49,569 |
| 2013 | -- | $55,253 | $8,820 | $46,433 |
Source: Public Records
Map
Nearby Homes
- 1022 Cyperts Trail
- 1406 Lull Water Ct
- 112 Rocking Wood Dr
- 24 Rocking Wood Dr
- 1136 Lexington Ridge Rd
- 156 Rocky Ridge Way
- 150 Rocky Ridge Way
- 23 Deer Canyon Dr
- 127 Deer Canyon Dr
- 101 Deer Canyon Dr
- 51 Deer Canyon Dr
- 37 Deer Canyon Dr
- 83 Deer Canyon Dr
- 817 Kenwood Ln
- 840 Champagne Ln
- 1420 Flanagan Mill Dr
- 857 Champagne Ln
- 1040 Denali Way
- 821 Coosawilla Way Unit Lot 27
- 821 Coosawilla Way
- 0 Denali Way
- 1042 Denali Way
- 823 Coosawilla Way
- 1039 Denali Way
- 1037 Denali Way
- 1035 Denali Way
- 1043 Denali Way
- 822 Coosawilla Way
- 1046 Denali Way
- 813 Coosawilla Way
- 815 Coosawilla Way
- 820 Coosawilla Way
- 1047 Denali Way
- 816 Coosawilla Way
- 1048 Denali Way
- 1020 Cyperts Trail
- 1018 Cyperts Trail