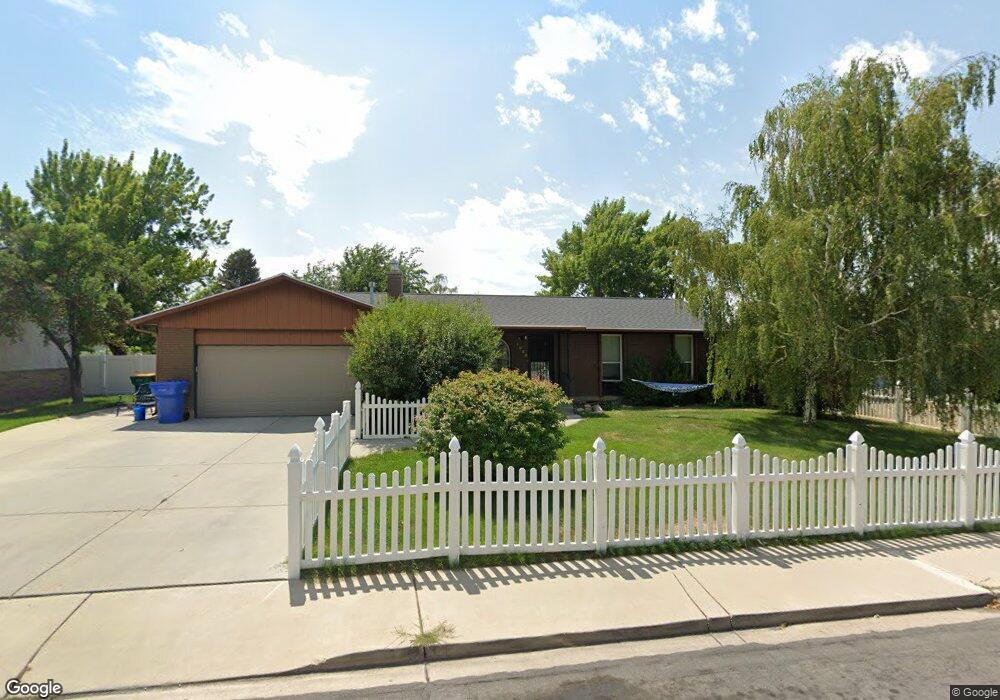
1038 E 680 N Orem, UT 84097
Orchard South NeighborhoodEstimated Value: $564,000 - $578,346
6
Beds
5
Baths
2,792
Sq Ft
$205/Sq Ft
Est. Value
About This Home
This home is located at 1038 E 680 N, Orem, UT 84097 and is currently estimated at $572,449, approximately $205 per square foot. 1038 E 680 N is a home located in Utah County with nearby schools including Foothill Elementary School, Canyon View Junior High School, and Orem High School.
Ownership History
Date
Name
Owned For
Owner Type
Purchase Details
Closed on
May 10, 2011
Sold by
Hansen Sam and Hansen Nancy
Bought by
Shields Travis S and Shields Amanda H
Current Estimated Value
Purchase Details
Closed on
Feb 27, 2007
Sold by
Harris David B and Harris Toni M
Bought by
Hansen Sam and Hansen Nancy
Home Financials for this Owner
Home Financials are based on the most recent Mortgage that was taken out on this home.
Original Mortgage
$238,500
Interest Rate
6.1%
Mortgage Type
Purchase Money Mortgage
Purchase Details
Closed on
Aug 31, 2000
Sold by
Prigmore Gerald Lee and Prigmore Bernice
Bought by
Harris David B and Harris Toni M
Home Financials for this Owner
Home Financials are based on the most recent Mortgage that was taken out on this home.
Original Mortgage
$143,200
Interest Rate
8.2%
Create a Home Valuation Report for This Property
The Home Valuation Report is an in-depth analysis detailing your home's value as well as a comparison with similar homes in the area
Home Values in the Area
Average Home Value in this Area
Purchase History
| Date | Buyer | Sale Price | Title Company |
|---|---|---|---|
| Shields Travis S | -- | Cornerstone Title Insurance | |
| Hansen Sam | -- | First American Title Insura | |
| Harris David B | -- | Empire Land Title Company |
Source: Public Records
Mortgage History
| Date | Status | Borrower | Loan Amount |
|---|---|---|---|
| Previous Owner | Hansen Sam | $238,500 | |
| Previous Owner | Harris David B | $143,200 |
Source: Public Records
Tax History
| Year | Tax Paid | Tax Assessment Tax Assessment Total Assessment is a certain percentage of the fair market value that is determined by local assessors to be the total taxable value of land and additions on the property. | Land | Improvement |
|---|---|---|---|---|
| 2025 | $2,325 | $302,115 | -- | -- |
| 2024 | $2,325 | $284,240 | $0 | $0 |
| 2023 | $2,118 | $278,410 | $0 | $0 |
| 2022 | $2,181 | $277,750 | $0 | $0 |
| 2021 | $1,854 | $357,600 | $147,500 | $210,100 |
| 2020 | $1,709 | $324,000 | $118,000 | $206,000 |
| 2019 | $1,556 | $306,700 | $107,600 | $199,100 |
| 2018 | $1,533 | $288,700 | $104,100 | $184,600 |
| 2017 | $1,517 | $153,065 | $0 | $0 |
| 2016 | $1,359 | $126,445 | $0 | $0 |
| 2015 | $1,405 | $123,585 | $0 | $0 |
| 2014 | $1,234 | $108,075 | $0 | $0 |
Source: Public Records
Map
Nearby Homes
- 551 N 900 E
- 566 N Bella Vista Dr
- 453 N 650 E
- 976 N 560 E
- 471 E 700 N
- 181 N 800 E
- 150 N 750 E
- 710 E 1280 N
- 80 N 1200 E
- 1324 N 750 E Unit 3
- 362 E 800 N Unit 1
- 733 E 1450 N Unit 5
- 1356 N 750 E Unit 11
- 1366 N 750 E
- 5005 N Edgewood Dr Unit 310
- 337 Birchwood Dr
- 747 E 1500 N Unit 13
- 713 E 1450 N Unit 23
- 85 S 1000 E
- 713 E 1500 St N Unit 19
Your Personal Tour Guide
Ask me questions while you tour the home.