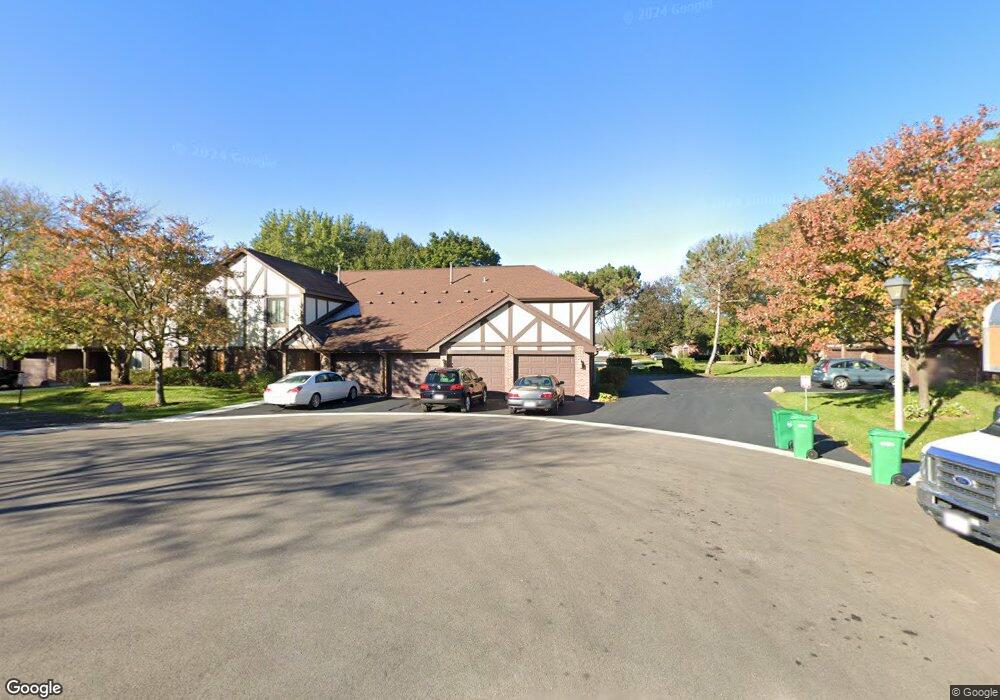
1038 Harbour Ct Unit 1AR Wheeling, IL 60090
Estimated Value: $195,339 - $264,000
2
Beds
--
Bath
9,960
Sq Ft
$23/Sq Ft
Est. Value
About This Home
This home is located at 1038 Harbour Ct Unit 1AR, Wheeling, IL 60090 and is currently estimated at $233,335, approximately $23 per square foot. 1038 Harbour Ct Unit 1AR is a home located in Cook County with nearby schools including Dwight D Eisenhower Elementary School, Anne Sullivan Elementary School, and Betsy Ross Elementary School.
Ownership History
Date
Name
Owned For
Owner Type
Purchase Details
Closed on
Oct 20, 2023
Sold by
Cadle Derby A
Bought by
Derby Ann Cadle Declaration Of Trust and Cadle
Current Estimated Value
Purchase Details
Closed on
Aug 18, 2005
Sold by
Genualdi Andre and Alasky Susan
Bought by
Cadle Derby A
Home Financials for this Owner
Home Financials are based on the most recent Mortgage that was taken out on this home.
Original Mortgage
$147,500
Interest Rate
5.89%
Mortgage Type
Fannie Mae Freddie Mac
Purchase Details
Closed on
Jun 26, 2003
Sold by
Plotkin Elaine and Plotkin Wendy
Bought by
Genualdi Andre and Alasky Susan
Home Financials for this Owner
Home Financials are based on the most recent Mortgage that was taken out on this home.
Original Mortgage
$156,750
Interest Rate
5.36%
Mortgage Type
Unknown
Purchase Details
Closed on
Jun 13, 2002
Sold by
Plotkin Seymour R and Plotkin Elaine
Bought by
Plotkin Elaine and Plotkin Wendy
Create a Home Valuation Report for This Property
The Home Valuation Report is an in-depth analysis detailing your home's value as well as a comparison with similar homes in the area
Home Values in the Area
Average Home Value in this Area
Purchase History
| Date | Buyer | Sale Price | Title Company |
|---|---|---|---|
| Derby Ann Cadle Declaration Of Trust | -- | None Listed On Document | |
| Cadle Derby A | $202,500 | Multiple | |
| Genualdi Andre | $165,000 | Multiple | |
| Plotkin Elaine | -- | -- |
Source: Public Records
Mortgage History
| Date | Status | Borrower | Loan Amount |
|---|---|---|---|
| Previous Owner | Cadle Derby A | $147,500 | |
| Previous Owner | Genualdi Andre | $156,750 |
Source: Public Records
Tax History Compared to Growth
Tax History
| Year | Tax Paid | Tax Assessment Tax Assessment Total Assessment is a certain percentage of the fair market value that is determined by local assessors to be the total taxable value of land and additions on the property. | Land | Improvement |
|---|---|---|---|---|
| 2024 | $2,516 | $15,103 | $4,162 | $10,941 |
| 2023 | $2,348 | $15,103 | $4,162 | $10,941 |
| 2022 | $2,348 | $15,103 | $4,162 | $10,941 |
| 2021 | $2,165 | $13,866 | $472 | $13,394 |
| 2020 | $3,466 | $13,866 | $472 | $13,394 |
| 2019 | $3,476 | $15,457 | $472 | $14,985 |
| 2018 | $2,294 | $10,685 | $378 | $10,307 |
| 2017 | $2,281 | $10,685 | $378 | $10,307 |
| 2016 | $2,376 | $10,685 | $378 | $10,307 |
| 2015 | $2,373 | $10,129 | $1,797 | $8,332 |
| 2014 | $2,330 | $10,129 | $1,797 | $8,332 |
| 2013 | $2,236 | $10,129 | $1,797 | $8,332 |
Source: Public Records
Map
Nearby Homes
- 1038 Harbour Ct Unit 2A
- 1054 Harbour Ct Unit 1A
- 1500 Harbour Dr Unit 1D
- 1500 Harbour Dr Unit 2K
- 2143 E Peachtree Ln
- 1925 E Waverly Ln
- 1044 Creekside Ct Unit 2B
- 2616 N Prindle Ave
- 412 Cherry Creek Ln
- 791 Lakeside Circle Dr Unit 1
- 2608 N Wilshire Ln
- 705 Lakeside Circle Dr Unit 2
- 691 Lakeside Circle Dr
- 671 Cedarwood Ct Unit 2
- 2812 Jackson Dr
- 2822 Jackson Dr
- 2060 N Charter Point Dr Unit 14
- 2632 N Windsor Dr Unit 104
- 2604 N Windsor Dr Unit 206
- 2640 N Windsor Dr Unit 102
- 1038 Harbour Ct Unit 1BR
- 1038 Harbour Ct Unit 2BR
- 1038 Harbour Ct Unit 2AR
- 1038 Harbour Ct Unit 1B
- 1048 Harbour Ct Unit 1AL
- 1048 Harbour Ct Unit 2AL
- 1048 Harbour Ct Unit 2BL
- 1048 Harbour Ct Unit 1BL
- 1048 Harbour Ct Unit 1B
- 1048 Harbour Ct Unit 2A
- 1048 Harbour Ct Unit 2B
- 1048 Harbour Ct Unit 1A
- 1012 Harbour Ct Unit 1B
- 1012 Harbour Ct Unit 1BR
- 1012 Harbour Ct Unit 1AR
- 1012 Harbour Ct Unit 2BR
- 1012 Harbour Ct Unit 2AR
- 1012 Harbour Ct Unit 2-B
- 1012 Harbour Ct Unit 1A
- 1012 Harbour Ct Unit 2A