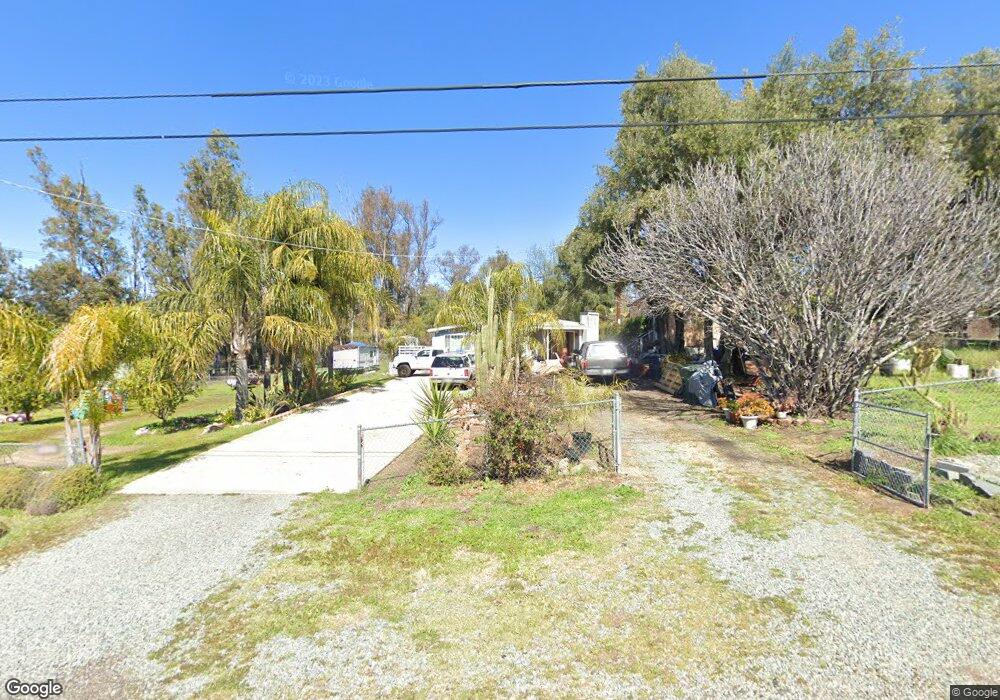
1038 Jakirk Ln Ramona, CA 92065
Estimated Value: $597,534 - $654,000
2
Beds
2
Baths
960
Sq Ft
$649/Sq Ft
Est. Value
About This Home
This home is located at 1038 Jakirk Ln, Ramona, CA 92065 and is currently estimated at $623,384, approximately $649 per square foot. 1038 Jakirk Ln is a home located in San Diego County with nearby schools including Ramona Elementary School, Olive Peirce Middle School, and Ramona High School.
Ownership History
Date
Name
Owned For
Owner Type
Purchase Details
Closed on
Mar 30, 1998
Sold by
Ziegler Kent A
Bought by
Plascencia Robert C and Plascencia Rosario
Current Estimated Value
Home Financials for this Owner
Home Financials are based on the most recent Mortgage that was taken out on this home.
Original Mortgage
$120,555
Interest Rate
7.13%
Purchase Details
Closed on
Feb 1, 1996
Sold by
Va
Bought by
Ziegler Kent A and Ziegler Sharon K
Home Financials for this Owner
Home Financials are based on the most recent Mortgage that was taken out on this home.
Original Mortgage
$116,107
Interest Rate
7.14%
Mortgage Type
Seller Take Back
Purchase Details
Closed on
Sep 1, 1995
Sold by
Leader Federal Bank For Svgs
Bought by
Va
Purchase Details
Closed on
Aug 30, 1995
Sold by
Roth William F and Roth Marilyn A
Bought by
Leader Federal Bank For Svgs
Purchase Details
Closed on
May 16, 1986
Create a Home Valuation Report for This Property
The Home Valuation Report is an in-depth analysis detailing your home's value as well as a comparison with similar homes in the area
Home Values in the Area
Average Home Value in this Area
Purchase History
| Date | Buyer | Sale Price | Title Company |
|---|---|---|---|
| Plascencia Robert C | $127,000 | Chicago Title Co | |
| Ziegler Kent A | $116,500 | United Title | |
| Va | -- | United Title Company | |
| Leader Federal Bank For Svgs | $93,549 | Benefit Land Title Company | |
| -- | $84,000 | -- |
Source: Public Records
Mortgage History
| Date | Status | Borrower | Loan Amount |
|---|---|---|---|
| Previous Owner | Plascencia Robert C | $120,555 | |
| Previous Owner | Ziegler Kent A | $116,107 |
Source: Public Records
Tax History
| Year | Tax Paid | Tax Assessment Tax Assessment Total Assessment is a certain percentage of the fair market value that is determined by local assessors to be the total taxable value of land and additions on the property. | Land | Improvement |
|---|---|---|---|---|
| 2025 | $2,885 | $201,961 | $119,740 | $82,221 |
| 2024 | $2,885 | $198,002 | $117,393 | $80,609 |
| 2023 | $2,009 | $194,121 | $115,092 | $79,029 |
| 2022 | $2,392 | $190,316 | $112,836 | $77,480 |
| 2021 | $2,355 | $186,585 | $110,624 | $75,961 |
| 2020 | $2,334 | $184,673 | $109,490 | $75,183 |
| 2019 | $2,285 | $181,053 | $107,344 | $73,709 |
| 2018 | $2,232 | $177,504 | $105,240 | $72,264 |
| 2017 | $650 | $174,025 | $103,177 | $70,848 |
| 2016 | $2,156 | $170,613 | $101,154 | $69,459 |
| 2015 | $2,129 | $168,051 | $99,635 | $68,416 |
| 2014 | $2,088 | $164,760 | $97,684 | $67,076 |
Source: Public Records
Map
Nearby Homes
- 19630 Camino Vista Unit 191
- 1121 11th St
- 40 acres Sutherland Dam Rd
- 1278 San Vicente Rd
- 1465 Barnett Rd
- 1212 H St Unit 121
- 1212 H St Unit 21
- 1212 H St Unit 202
- 1212 H St Unit 14
- 1212 H St Unit 95
- 1212 H St Unit 158
- 1212 H St Unit 157
- 1212 H St Unit 120
- 1212 H St Unit 48
- 1212 H St Unit 38
- 1212 H St Unit 116
- 842 11th St
- 915 9th St
- 677 Hanson Ln
- 1340 H St
- 1244 Barnett Rd
- 1253 Barnett Rd
- 1261 Barnett Rd
- 1282 Barnett Rd
- 1047 Jakirk Ln
- 1034 Barger Place
- 1275 Barnett Rd
- 1016 Barger Place
- 1208 Barnett Rd
- 1241 Barnett Rd
- 1247 Barnett Rd
- 1116 Barger Place
- 1290 Barnett Rd
- 1287 Barnett Rd
- 1009 Jakirk Ln
- 1024 Jakirk Ln
- 1122 Barger Place
- 1144 Caminito Connie
- 1165 Caminito Connie
- 1310 Barnett Rd
Your Personal Tour Guide
Ask me questions while you tour the home.