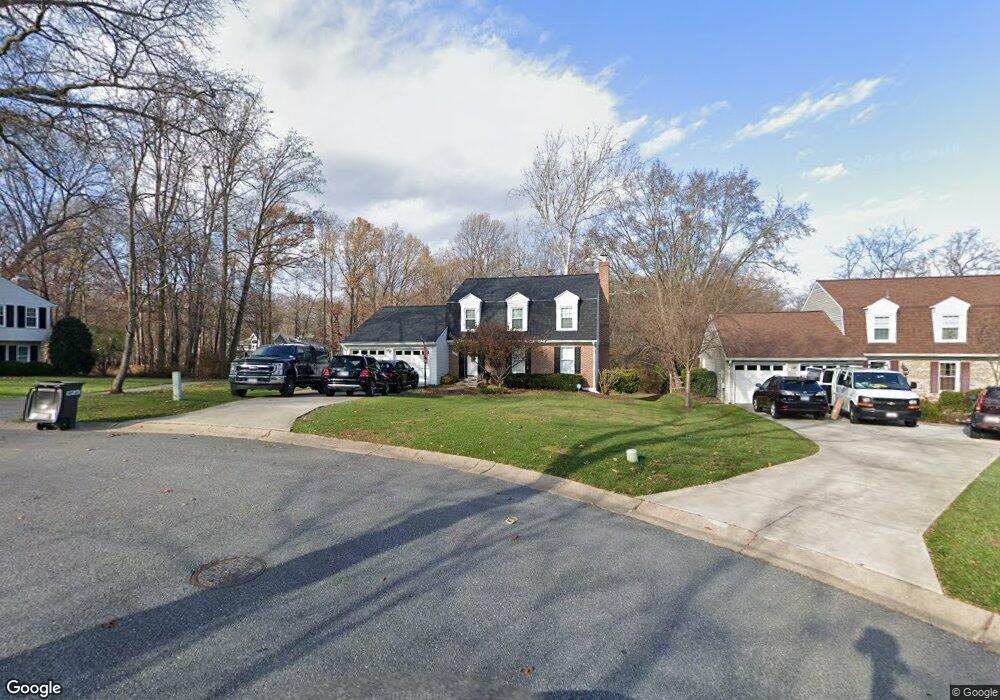
10382 Eclipse Way Columbia, MD 21044
Hickory Ridge NeighborhoodEstimated Value: $631,089 - $671,000
4
Beds
3
Baths
1,947
Sq Ft
$335/Sq Ft
Est. Value
About This Home
This home is located at 10382 Eclipse Way, Columbia, MD 21044 and is currently estimated at $652,022, approximately $334 per square foot. 10382 Eclipse Way is a home located in Howard County with nearby schools including Clemens Crossing Elementary School, Wilde Lake Middle, and Atholton High School.
Ownership History
Date
Name
Owned For
Owner Type
Purchase Details
Closed on
Oct 17, 2005
Sold by
Ritt Kurl and Ritt Daniel
Bought by
Gibbons Patrick M
Current Estimated Value
Home Financials for this Owner
Home Financials are based on the most recent Mortgage that was taken out on this home.
Original Mortgage
$415,200
Outstanding Balance
$210,493
Interest Rate
5.12%
Mortgage Type
Adjustable Rate Mortgage/ARM
Estimated Equity
$441,529
Purchase Details
Closed on
Oct 13, 2005
Sold by
Daniel Kurl and Daniel Ritt
Bought by
Gibbons Patrick M
Home Financials for this Owner
Home Financials are based on the most recent Mortgage that was taken out on this home.
Original Mortgage
$415,200
Outstanding Balance
$210,493
Interest Rate
5.12%
Mortgage Type
Adjustable Rate Mortgage/ARM
Estimated Equity
$441,529
Purchase Details
Closed on
Jun 23, 2004
Sold by
P Kurl
Bought by
Ritt Kurland Daniel
Purchase Details
Closed on
Jun 18, 2004
Sold by
Kurl and Alan P
Bought by
Kurland Daniel Ritt
Create a Home Valuation Report for This Property
The Home Valuation Report is an in-depth analysis detailing your home's value as well as a comparison with similar homes in the area
Home Values in the Area
Average Home Value in this Area
Purchase History
| Date | Buyer | Sale Price | Title Company |
|---|---|---|---|
| Gibbons Patrick M | $519,000 | -- | |
| Gibbons Patrick M | $519,000 | -- | |
| Ritt Kurland Daniel | $375,000 | -- | |
| Kurland Daniel Ritt | $375,000 | -- |
Source: Public Records
Mortgage History
| Date | Status | Borrower | Loan Amount |
|---|---|---|---|
| Open | Gibbons Patrick M | $415,200 | |
| Closed | Gibbons Patrick M | $51,900 | |
| Closed | Kurland Daniel Ritt | -- |
Source: Public Records
Tax History
| Year | Tax Paid | Tax Assessment Tax Assessment Total Assessment is a certain percentage of the fair market value that is determined by local assessors to be the total taxable value of land and additions on the property. | Land | Improvement |
|---|---|---|---|---|
| 2025 | $7,709 | $520,733 | $0 | $0 |
| 2024 | $7,709 | $504,400 | $261,800 | $242,600 |
| 2023 | $7,206 | $477,933 | $0 | $0 |
| 2022 | $6,837 | $451,467 | $0 | $0 |
| 2021 | $6,343 | $425,000 | $225,900 | $199,100 |
| 2020 | $6,343 | $412,533 | $0 | $0 |
| 2019 | $6,164 | $400,067 | $0 | $0 |
| 2018 | $5,672 | $387,600 | $169,600 | $218,000 |
| 2017 | $5,593 | $387,600 | $0 | $0 |
| 2016 | $1,274 | $379,067 | $0 | $0 |
| 2015 | $1,274 | $374,800 | $0 | $0 |
| 2014 | $1,274 | $374,800 | $0 | $0 |
Source: Public Records
Map
Nearby Homes
- 10397 Blue Arrow Ct
- 6680 Buttonhole Ct
- 10724 Hidden Ridge Dr
- 7944 Harriet Tubman Ln
- 10684 Quarterstaff Rd
- 10623 Millet Seed Hill
- 6642 Seneca Dr
- 6365 Bright Plume
- 6241 Martin Rd
- 6614 Corina Ct
- 6125 Wooded Run Dr
- 6913 Annabel Ct
- 10204 Shaker Dr
- 6650 Allview Dr
- 10807 Timber View Way
- 10517 E Wind Way
- 8428 Braddock Way
- 8416 Braddock Way
- 6025 Weekend Way
- 6099 Babylon Crest
- 10378 Eclipse Way
- 10386 Eclipse Way
- 10374 Eclipse Way
- 10387 Eclipse Way
- 10352 Blue Arrow Ct
- 10370 Eclipse Way
- 10356 Blue Arrow Ct
- 10360 Blue Arrow Ct
- 10401 Fair Oaks
- 10379 Eclipse Way
- 10383 Eclipse Way
- 10366 Eclipse Way
- 10405 Fair Oaks
- 10375 Eclipse Way
- 10409 Fair Oaks
- 10371 Eclipse Way
- 10390 Quarterstaff Rd
- 10414 Blue Arrow Ct
- 10367 Eclipse Way
- 9999 Fare Rd
Your Personal Tour Guide
Ask me questions while you tour the home.