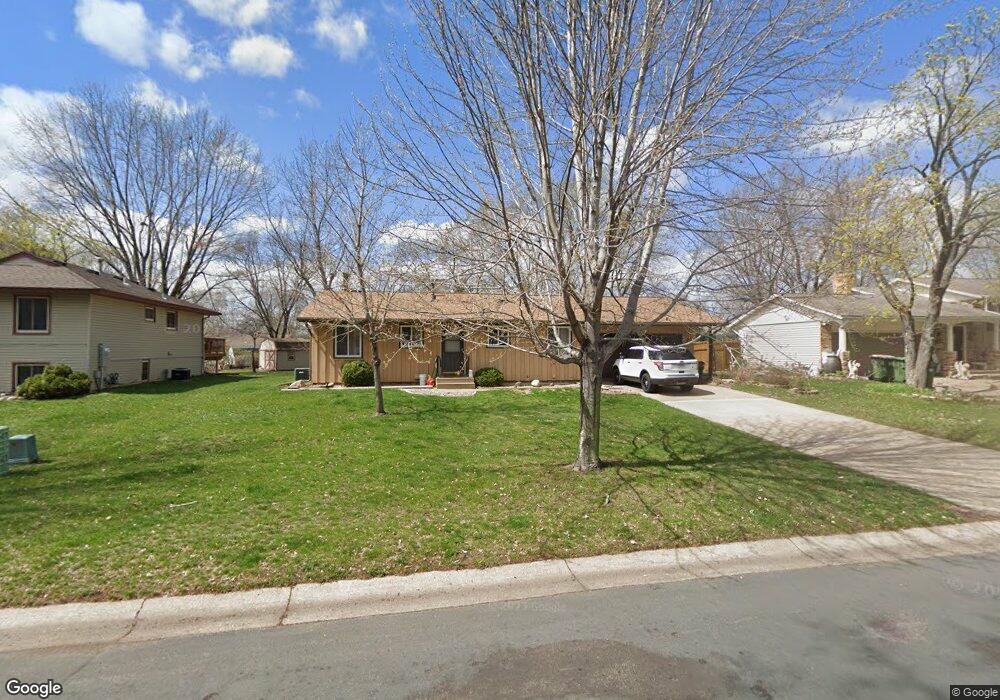
10383 Thrush St NW Coon Rapids, MN 55433
Estimated Value: $305,000 - $334,119
4
Beds
1
Bath
1,006
Sq Ft
$323/Sq Ft
Est. Value
About This Home
This home is located at 10383 Thrush St NW, Coon Rapids, MN 55433 and is currently estimated at $324,530, approximately $322 per square foot. 10383 Thrush St NW is a home located in Anoka County with nearby schools including Lucile Bruner Elementary School, Mississippi Elementary School, and Laughlin Junior/Senior High School.
Ownership History
Date
Name
Owned For
Owner Type
Purchase Details
Closed on
Jul 10, 2020
Sold by
Yang David and Lee Choua
Bought by
Weisenburger Joshua John
Current Estimated Value
Home Financials for this Owner
Home Financials are based on the most recent Mortgage that was taken out on this home.
Original Mortgage
$225,150
Outstanding Balance
$199,648
Interest Rate
3.1%
Mortgage Type
New Conventional
Estimated Equity
$124,882
Purchase Details
Closed on
Feb 7, 2019
Sold by
Kens Carpentry Llc
Bought by
Yang David and Lee Choua
Home Financials for this Owner
Home Financials are based on the most recent Mortgage that was taken out on this home.
Original Mortgage
$211,460
Interest Rate
4.5%
Mortgage Type
New Conventional
Purchase Details
Closed on
Nov 23, 2018
Sold by
Anderson Roy M
Bought by
Kens Carpentry Llc
Home Financials for this Owner
Home Financials are based on the most recent Mortgage that was taken out on this home.
Original Mortgage
$115,000
Interest Rate
4.8%
Mortgage Type
Purchase Money Mortgage
Create a Home Valuation Report for This Property
The Home Valuation Report is an in-depth analysis detailing your home's value as well as a comparison with similar homes in the area
Home Values in the Area
Average Home Value in this Area
Purchase History
| Date | Buyer | Sale Price | Title Company |
|---|---|---|---|
| Weisenburger Joshua John | $237,000 | Titlesmart Inc | |
| Yang David | $218,000 | Titlesmart Inc | |
| Kens Carpentry Llc | $115,000 | North American Title Company |
Source: Public Records
Mortgage History
| Date | Status | Borrower | Loan Amount |
|---|---|---|---|
| Open | Weisenburger Joshua John | $225,150 | |
| Previous Owner | Yang David | $211,460 | |
| Previous Owner | Kens Carpentry Llc | $115,000 |
Source: Public Records
Tax History Compared to Growth
Tax History
| Year | Tax Paid | Tax Assessment Tax Assessment Total Assessment is a certain percentage of the fair market value that is determined by local assessors to be the total taxable value of land and additions on the property. | Land | Improvement |
|---|---|---|---|---|
| 2025 | $2,941 | $294,500 | $90,000 | $204,500 |
| 2024 | $2,941 | $287,300 | $87,000 | $200,300 |
| 2023 | $2,653 | $283,600 | $83,000 | $200,600 |
| 2022 | $2,513 | $276,300 | $67,000 | $209,300 |
| 2021 | $2,438 | $235,100 | $67,000 | $168,100 |
| 2020 | $2,344 | $223,800 | $65,000 | $158,800 |
| 2019 | $2,129 | $207,900 | $62,000 | $145,900 |
| 2018 | $1,989 | $186,000 | $0 | $0 |
| 2017 | $1,707 | $170,600 | $0 | $0 |
| 2016 | $1,734 | $147,200 | $0 | $0 |
| 2015 | -- | $147,200 | $46,000 | $101,200 |
| 2014 | -- | $124,700 | $35,200 | $89,500 |
Source: Public Records
Map
Nearby Homes
- 10136 Uplander St NW
- 10309 Yukon St NW
- 2001 103rd Ln NW
- 10200 Mississippi Blvd NW
- 10648 Wren St NW
- 2201 108th Ave NW
- 10616 Arrowhead St NW
- 1900 Coon Rapids Blvd NW Unit 1
- 2633 103rd Ave NW
- 2400 108th Ave NW
- 1920 108th Ln NW
- 10634 Hummingbird St NW
- 11000 Swallow St NW
- 10658 Hummingbird St NW
- 2721 109th Ave NW
- 11036 Hanson Blvd NW Unit 20
- 2728 109th Ln NW
- 1547 Coon Rapids Blvd NW
- 2965 108th Ln NW
- 9967 Egret Blvd NW
- 10369 Thrush St NW
- 10397 Thrush St NW
- 10355 Thrush St NW
- 10384 Thrush St NW
- 10398 Thrush St NW
- 10411 Thrush St NW
- 10380 Uplander St NW
- 10370 Uplander St NW
- 10370 Thrush St NW
- 10390 Uplander St NW
- 10412 Thrush St NW
- 10360 Uplander St NW
- 10341 Thrush St NW
- 10425 Thrush St NW
- 10400 Uplander St NW
- 10426 Thrush St NW
- 10356 Thrush St NW
- 10350 Uplander St NW
- 10410 Uplander St NW
- 10327 Thrush St NW