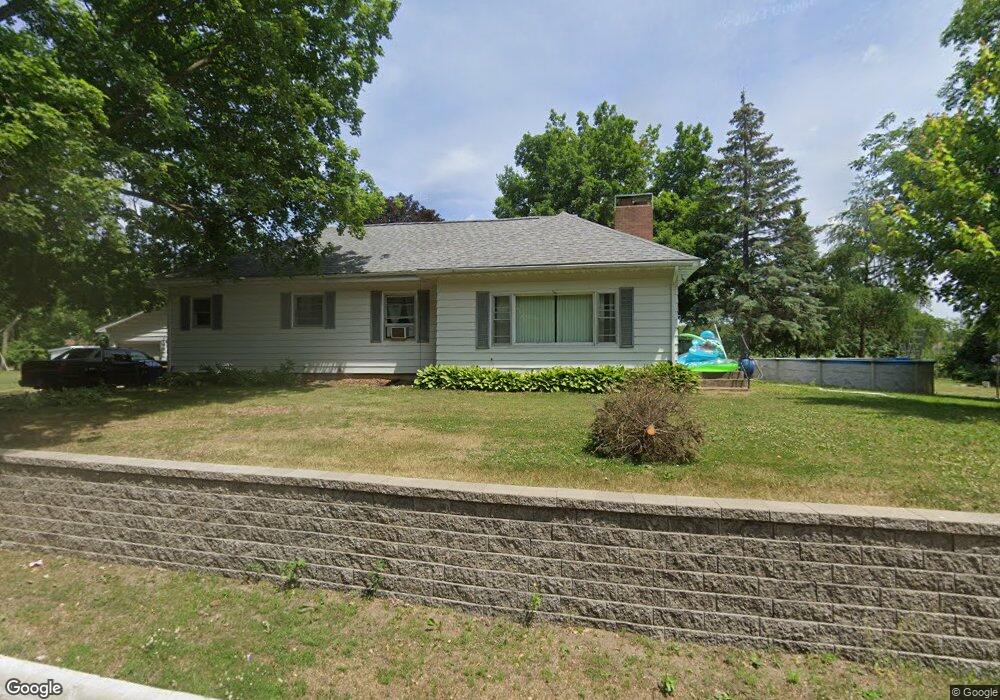
1039 11th Ave NE Faribault, MN 55021
Estimated Value: $287,000 - $318,000
3
Beds
2
Baths
1,584
Sq Ft
$194/Sq Ft
Est. Value
About This Home
This home is located at 1039 11th Ave NE, Faribault, MN 55021 and is currently estimated at $306,768, approximately $193 per square foot. 1039 11th Ave NE is a home located in Rice County with nearby schools including Roosevelt Elementary School, Faribault Middle School, and Faribault Senior High School.
Ownership History
Date
Name
Owned For
Owner Type
Purchase Details
Closed on
Jul 1, 2015
Sold by
Trump Randy Randy
Bought by
Daily Robert Robert
Current Estimated Value
Home Financials for this Owner
Home Financials are based on the most recent Mortgage that was taken out on this home.
Original Mortgage
$130,800
Outstanding Balance
$102,557
Interest Rate
4.02%
Estimated Equity
$204,211
Create a Home Valuation Report for This Property
The Home Valuation Report is an in-depth analysis detailing your home's value as well as a comparison with similar homes in the area
Home Values in the Area
Average Home Value in this Area
Purchase History
| Date | Buyer | Sale Price | Title Company |
|---|---|---|---|
| Daily Robert Robert | $135,000 | -- |
Source: Public Records
Mortgage History
| Date | Status | Borrower | Loan Amount |
|---|---|---|---|
| Open | Daily Robert Robert | $130,800 |
Source: Public Records
Tax History Compared to Growth
Tax History
| Year | Tax Paid | Tax Assessment Tax Assessment Total Assessment is a certain percentage of the fair market value that is determined by local assessors to be the total taxable value of land and additions on the property. | Land | Improvement |
|---|---|---|---|---|
| 2025 | $4,040 | $265,500 | $86,000 | $179,500 |
| 2024 | $4,040 | $230,100 | $80,300 | $149,800 |
| 2023 | $3,636 | $230,100 | $80,300 | $149,800 |
| 2022 | $3,382 | $216,800 | $77,400 | $139,400 |
| 2021 | $3,262 | $183,700 | $63,100 | $120,600 |
| 2020 | $3,562 | $171,900 | $64,800 | $107,100 |
| 2019 | $3,614 | $193,900 | $61,700 | $132,200 |
| 2018 | $2,200 | $185,900 | $61,700 | $124,200 |
| 2017 | $2,140 | $180,700 | $61,700 | $119,000 |
| 2016 | $2,074 | $171,600 | $61,700 | $109,900 |
| 2015 | $1,936 | $164,100 | $61,700 | $102,400 |
| 2014 | -- | $161,200 | $61,700 | $99,500 |
Source: Public Records
Map
Nearby Homes
- 1107 Shumway Ct
- 905 Orchard Heights Ct
- 854 Rogers Row
- 815 Rogers Row
- 308 Erblang Ave
- Parkdale Plan at The Meadows
- St. Croix Plan at The Meadows
- McKenna Plan at The Meadows
- Monroe Plan at The Meadows
- Mayberry Plan at The Meadows
- Marquette Plan at The Meadows
- Majestic Plan at The Meadows
- Macalaster Plan at The Meadows
- Linden Plan at The Meadows
- Hammond Plan at The Meadows
- Everleigh Plan at The Meadows
- Garrison Plan at The Meadows
- Enclave II Plan at The Meadows
- Eastbrook Plan at The Meadows
- Cottonwood II Plan at The Meadows
- XXXX 11th Ave NE
- 1115 Maple Ln
- 1123 11th Ave NE
- 1207 Maple Ln
- 1031 11th Ave NE
- 1215 Maple Ln
- 1114 Maple Ln
- 1122 Maple Ln
- 1028 11th Ave NE
- 1106 Maple Ln
- 1204 Maple Ln
- 1110 11th Ave NE
- 1032 11th Ave NE
- 1214 Maple Ln
- 1223 Maple Ln
- 1022 11th Ave NE
- 1025 11th Ave NE
- 1016 11th Ave NE
- 1208 11th Ave NE
- 1239 Maple Ln