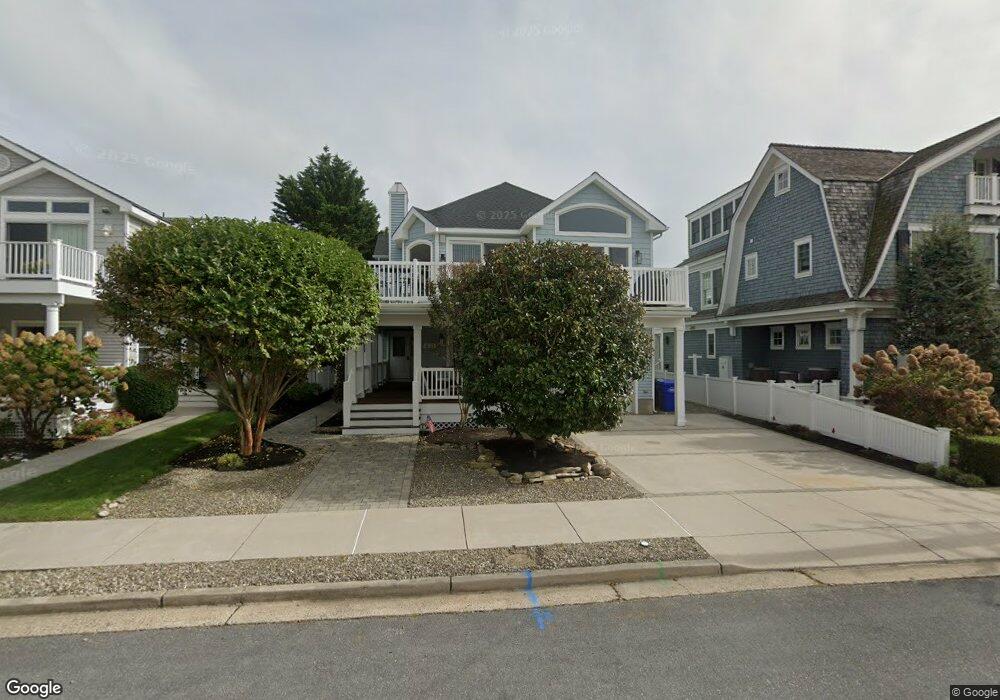
1039 1st Ave Avalon, NJ 08202
Estimated Value: $3,849,706 - $4,643,000
--
Bed
--
Bath
3,149
Sq Ft
$1,346/Sq Ft
Est. Value
About This Home
This home is located at 1039 1st Ave, Avalon, NJ 08202 and is currently estimated at $4,238,427, approximately $1,345 per square foot. 1039 1st Ave is a home located in Cape May County with nearby schools including Avalon Elementary School.
Ownership History
Date
Name
Owned For
Owner Type
Purchase Details
Closed on
May 24, 2016
Sold by
Mchale Eugene
Bought by
Mchale Eugene A
Current Estimated Value
Purchase Details
Closed on
Mar 30, 2005
Sold by
Welsh Thomas J
Bought by
Mchale Eugene
Home Financials for this Owner
Home Financials are based on the most recent Mortgage that was taken out on this home.
Original Mortgage
$275,000
Interest Rate
5.7%
Mortgage Type
Credit Line Revolving
Purchase Details
Closed on
Jul 23, 2004
Sold by
Phillips George W and Phillips Dolores B
Bought by
Welsh Thomas J
Create a Home Valuation Report for This Property
The Home Valuation Report is an in-depth analysis detailing your home's value as well as a comparison with similar homes in the area
Home Values in the Area
Average Home Value in this Area
Purchase History
| Date | Buyer | Sale Price | Title Company |
|---|---|---|---|
| Mchale Eugene A | -- | Attorney | |
| Mchale Eugene | $1,800,000 | -- | |
| Welsh Thomas J | $1,000,000 | -- |
Source: Public Records
Mortgage History
| Date | Status | Borrower | Loan Amount |
|---|---|---|---|
| Previous Owner | Mchale Eugene | $275,000 | |
| Previous Owner | Mchale Eugene | $1,345,000 |
Source: Public Records
Tax History Compared to Growth
Tax History
| Year | Tax Paid | Tax Assessment Tax Assessment Total Assessment is a certain percentage of the fair market value that is determined by local assessors to be the total taxable value of land and additions on the property. | Land | Improvement |
|---|---|---|---|---|
| 2025 | $12,659 | $2,061,800 | $1,200,000 | $861,800 |
| 2024 | $12,659 | $2,061,800 | $1,200,000 | $861,800 |
| 2023 | $12,556 | $2,061,800 | $1,200,000 | $861,800 |
| 2022 | $11,711 | $2,061,800 | $1,200,000 | $861,800 |
| 2021 | $10,162 | $1,992,600 | $1,200,000 | $792,600 |
| 2020 | $10,481 | $1,992,600 | $1,200,000 | $792,600 |
| 2019 | $10,162 | $1,992,600 | $1,200,000 | $792,600 |
| 2018 | $9,724 | $1,992,600 | $1,200,000 | $792,600 |
| 2017 | $9,635 | $1,732,900 | $900,000 | $832,900 |
| 2016 | $9,531 | $1,732,900 | $900,000 | $832,900 |
| 2015 | $9,375 | $1,732,900 | $900,000 | $832,900 |
| 2014 | $9,271 | $1,732,900 | $900,000 | $832,900 |
Source: Public Records
Map
Nearby Homes