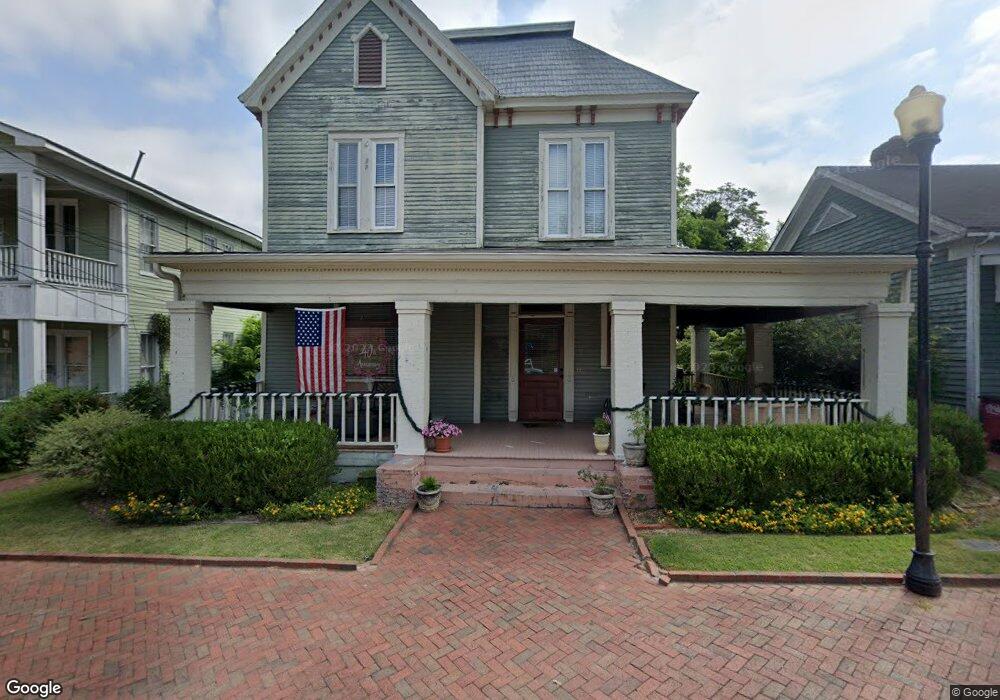
1039 Bond St Macon, GA 31201
InTown NeighborhoodEstimated Value: $316,000 - $380,000
4
Beds
2
Baths
2,962
Sq Ft
$119/Sq Ft
Est. Value
About This Home
This home is located at 1039 Bond St, Macon, GA 31201 and is currently estimated at $351,574, approximately $118 per square foot. 1039 Bond St is a home located in Bibb County with nearby schools including Williams Elementary School, Miller Fine Arts Magnet Middle School, and Central High School.
Ownership History
Date
Name
Owned For
Owner Type
Purchase Details
Closed on
Aug 22, 2023
Sold by
Titshaw Virginia L
Bought by
Titshaw Scott C
Current Estimated Value
Purchase Details
Closed on
Jan 24, 2018
Sold by
Springwal Hudson Family Parnership Lllp
Bought by
Titshaw Scott Carl and Titshaw Virginia L
Purchase Details
Closed on
Dec 16, 1997
Sold by
Hudson J Hugh
Bought by
Springwal-Hudson Family
Create a Home Valuation Report for This Property
The Home Valuation Report is an in-depth analysis detailing your home's value as well as a comparison with similar homes in the area
Home Values in the Area
Average Home Value in this Area
Purchase History
| Date | Buyer | Sale Price | Title Company |
|---|---|---|---|
| Titshaw Scott C | -- | None Listed On Document | |
| Titshaw Scott Carl | $180,000 | None Available | |
| Springwal-Hudson Family | -- | -- |
Source: Public Records
Tax History
| Year | Tax Paid | Tax Assessment Tax Assessment Total Assessment is a certain percentage of the fair market value that is determined by local assessors to be the total taxable value of land and additions on the property. | Land | Improvement |
|---|---|---|---|---|
| 2025 | $3,171 | $129,032 | $14,850 | $114,182 |
| 2024 | $3,149 | $123,988 | $14,850 | $109,138 |
| 2023 | $2,851 | $112,269 | $11,200 | $101,069 |
| 2022 | $3,812 | $110,098 | $13,712 | $96,386 |
| 2021 | $3,784 | $99,585 | $13,712 | $85,873 |
| 2020 | $3,433 | $88,418 | $13,059 | $75,359 |
| 2019 | $2,818 | $88,418 | $13,059 | $75,359 |
| 2018 | $6,021 | $88,418 | $13,059 | $75,359 |
| 2017 | $3,313 | $88,418 | $13,059 | $75,359 |
| 2016 | $3,059 | $88,418 | $13,059 | $75,359 |
| 2015 | $4,330 | $88,418 | $13,059 | $75,359 |
| 2014 | $1,660 | $88,418 | $13,059 | $75,359 |
Source: Public Records
Map
Nearby Homes
- 312 College St Unit 3
- 1120 Georgia Ave
- 417 Orange St
- 132 Madison St
- 349 Madison St
- 353 Madison St
- 338 Monroe St
- 1552 Woodliff St
- 619 College St
- 676 College St
- 1740 5th Ave W
- 632 Monroe St
- 1730 Second Ave
- 1812 5th Ave W
- 565 Poplar St
- 534 2nd St
- 522 Cherry St
- 522 Cherry St Unit 201
- 522 Cherry St Unit 301
- 336 Empire Ave
Your Personal Tour Guide
Ask me questions while you tour the home.