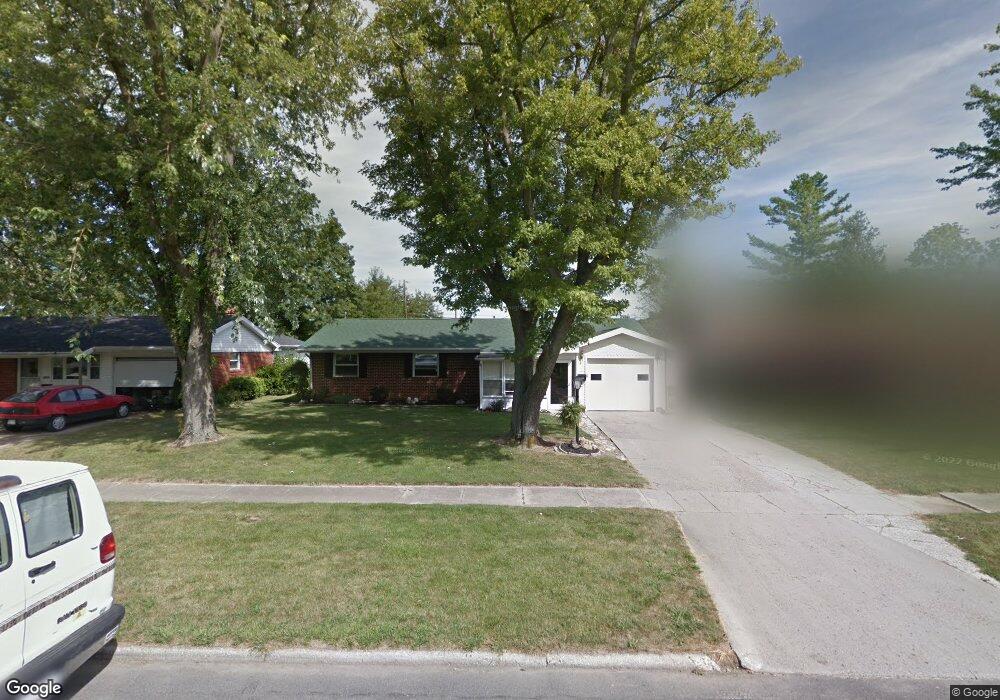
1039 Brookside Dr Findlay, OH 45840
Estimated Value: $174,000 - $207,000
3
Beds
2
Baths
1,209
Sq Ft
$158/Sq Ft
Est. Value
About This Home
This home is located at 1039 Brookside Dr, Findlay, OH 45840 and is currently estimated at $190,923, approximately $157 per square foot. 1039 Brookside Dr is a home located in Hancock County with nearby schools including Whittier Elementary School, Wilson Vance Elementary School, and Donnell Middle School.
Ownership History
Date
Name
Owned For
Owner Type
Purchase Details
Closed on
Mar 12, 2009
Sold by
Richmond Yancy D and Wilhelm Nicole
Bought by
Wilhelm Nicole and Wilhelm Karen K
Current Estimated Value
Purchase Details
Closed on
Aug 24, 2007
Sold by
Wilhelm Karen K and Powell Nicole
Bought by
Powell Nicole
Purchase Details
Closed on
Dec 9, 2003
Sold by
Kirvan Margaret R and Kirvan Margaret Ruth
Bought by
Richmond Yancy D and Wilhelm Nicole
Home Financials for this Owner
Home Financials are based on the most recent Mortgage that was taken out on this home.
Original Mortgage
$80,750
Outstanding Balance
$39,675
Interest Rate
6.75%
Mortgage Type
Purchase Money Mortgage
Estimated Equity
$151,248
Create a Home Valuation Report for This Property
The Home Valuation Report is an in-depth analysis detailing your home's value as well as a comparison with similar homes in the area
Home Values in the Area
Average Home Value in this Area
Purchase History
| Date | Buyer | Sale Price | Title Company |
|---|---|---|---|
| Wilhelm Nicole | -- | Service Link | |
| Powell Nicole | -- | None Available | |
| Richmond Yancy D | $85,000 | Mid Am Title |
Source: Public Records
Mortgage History
| Date | Status | Borrower | Loan Amount |
|---|---|---|---|
| Open | Richmond Yancy D | $80,750 |
Source: Public Records
Tax History
| Year | Tax Paid | Tax Assessment Tax Assessment Total Assessment is a certain percentage of the fair market value that is determined by local assessors to be the total taxable value of land and additions on the property. | Land | Improvement |
|---|---|---|---|---|
| 2024 | $1,678 | $47,130 | $6,010 | $41,120 |
| 2023 | $1,680 | $47,130 | $6,010 | $41,120 |
| 2022 | $1,675 | $47,130 | $6,010 | $41,120 |
| 2021 | $1,511 | $36,980 | $6,010 | $30,970 |
| 2020 | $1,509 | $36,980 | $6,010 | $30,970 |
| 2019 | $1,478 | $36,980 | $6,010 | $30,970 |
| 2018 | $1,312 | $30,090 | $5,460 | $24,630 |
| 2017 | $656 | $30,090 | $5,460 | $24,630 |
| 2016 | $1,303 | $30,090 | $5,460 | $24,630 |
| 2015 | $1,461 | $33,340 | $6,370 | $26,970 |
| 2014 | $1,461 | $33,340 | $6,370 | $26,970 |
| 2012 | $1,473 | $33,340 | $6,370 | $26,970 |
Source: Public Records
Map
Nearby Homes
- 1037 Fishlock Ave
- 15591 Canadian Way
- 15586 Canadian Way
- 15615 Canadian Way
- 1105 1st St
- 1100 Stall Dr
- 0 Blanchard Ave
- 731 5th St
- 1001 Decker Ave
- 1421 Autumn Dr
- 623 E Sandusky St
- 1421 E Sandusky St
- 1638 Westview Dr
- 309 Huron Rd
- 423 1st St
- 313 2nd St
- 829 Maple Ave
- 216 1st St
- 100 Warrington Ave
- 206 Greenlawn Ave
- 1035 Brookside Dr
- 1101 Brookside Dr
- 1031 Brookside Dr
- 1038 Brookside Dr
- 1100 Brookside Dr
- 1034 Brookside Dr
- 1104 Brookside Dr
- 1030 Brookside Dr
- 1115 Brookside Dr
- 1108 Brookside Dr
- 1504 Lippincott Ave
- 1119 Brookside Dr
- 1112 Brookside Dr
- 1039 Fairview Dr
- 1035 Fairview Dr
- 1101 Fairview Dr
- 1031 Fairview Dr
- 1105 Fairview Dr
- 1123 Brookside Dr
- 1027 1st St
Your Personal Tour Guide
Ask me questions while you tour the home.