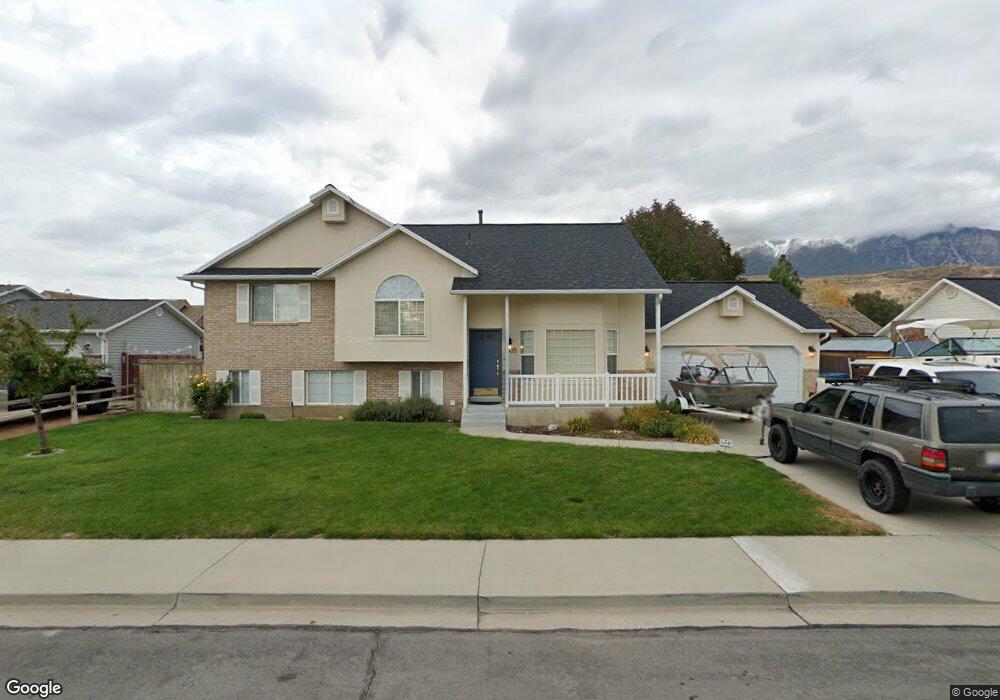
1039 E 760 N Orem, UT 84097
Orchard South NeighborhoodEstimated Value: $451,000 - $580,000
3
Beds
2
Baths
1,269
Sq Ft
$408/Sq Ft
Est. Value
About This Home
This home is located at 1039 E 760 N, Orem, UT 84097 and is currently estimated at $518,339, approximately $408 per square foot. 1039 E 760 N is a home located in Utah County with nearby schools including Foothill Elementary School, Canyon View Junior High School, and Orem High School.
Ownership History
Date
Name
Owned For
Owner Type
Purchase Details
Closed on
Feb 14, 2007
Sold by
Hamby Matthew S
Bought by
Hamby Family Properties Llc
Current Estimated Value
Purchase Details
Closed on
Feb 5, 2007
Sold by
Hamby Mariann E
Bought by
Hamby Family Properties Llc
Purchase Details
Closed on
Feb 2, 2007
Sold by
Hamby Steven R
Bought by
Hamby Family Properties Llc
Purchase Details
Closed on
Jan 30, 2007
Sold by
Hamby Deborah S
Bought by
Hamby Family Properties Llc
Purchase Details
Closed on
Dec 5, 2000
Sold by
Bastian Dick E and Bastian Susan L
Bought by
Hamby Matthew S and Hamby Mariann E
Purchase Details
Closed on
Oct 5, 2000
Sold by
Bastian Dick E and Bastian Susan L
Bought by
Hamby Matthew S and Hamby Mariann E
Create a Home Valuation Report for This Property
The Home Valuation Report is an in-depth analysis detailing your home's value as well as a comparison with similar homes in the area
Home Values in the Area
Average Home Value in this Area
Purchase History
| Date | Buyer | Sale Price | Title Company |
|---|---|---|---|
| Hamby Family Properties Llc | -- | None Available | |
| Hamby Family Properties Llc | -- | None Available | |
| Hamby Family Properties Llc | -- | None Available | |
| Hamby Family Properties Llc | -- | None Available | |
| Hamby Family Properties Llc | -- | None Available | |
| Hamby Matthew S | -- | -- | |
| Hamby Matthew S | -- | -- |
Source: Public Records
Tax History
| Year | Tax Paid | Tax Assessment Tax Assessment Total Assessment is a certain percentage of the fair market value that is determined by local assessors to be the total taxable value of land and additions on the property. | Land | Improvement |
|---|---|---|---|---|
| 2025 | $2,160 | $270,820 | -- | -- |
| 2024 | $2,160 | $264,110 | $0 | $0 |
| 2023 | $2,029 | $266,695 | $0 | $0 |
| 2022 | $2,107 | $268,290 | $0 | $0 |
| 2021 | $1,779 | $343,100 | $148,300 | $194,800 |
| 2020 | $1,634 | $309,600 | $118,600 | $191,000 |
| 2019 | $1,518 | $299,200 | $108,200 | $191,000 |
| 2018 | $1,438 | $270,800 | $104,700 | $166,100 |
| 2017 | $1,343 | $135,520 | $0 | $0 |
| 2016 | $1,284 | $119,405 | $0 | $0 |
| 2015 | $1,260 | $110,825 | $0 | $0 |
| 2014 | $1,206 | $105,600 | $0 | $0 |
Source: Public Records
Map
Nearby Homes
- 551 N 900 E
- 685 E 500 N
- 976 N 560 E
- 471 E 700 N
- 353 N 600 E
- 150 N 750 E
- 1324 N 750 E Unit 3
- 80 N 1200 E
- 733 E 1450 N Unit 5
- 1356 N 750 E Unit 11
- 362 E 800 N Unit 1
- 1366 N 750 E Unit LOT 12
- 713 E 1450 N Unit 23
- 5005 N Edgewood Dr Unit 310
- 713 E 1500 St N Unit 19
- 337 Birchwood Dr
- 356 N 360 E
- 85 S 1000 E
- 372 E 1165 N
- 305 E Elmwood Dr
Your Personal Tour Guide
Ask me questions while you tour the home.