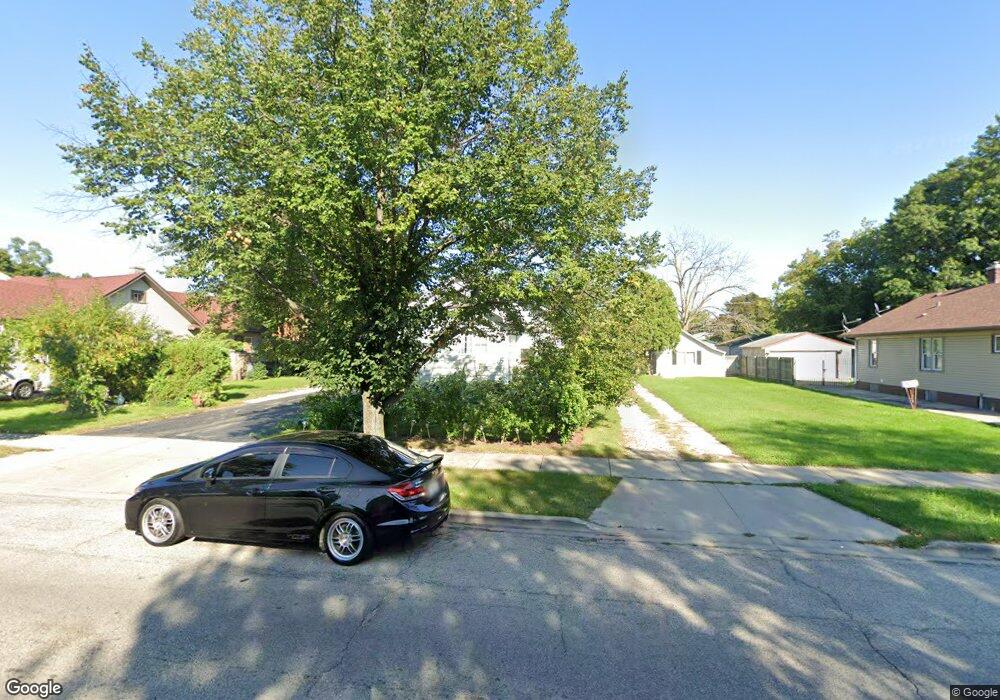
1039 N Butrick St Waukegan, IL 60085
Waukegan Gardens NeighborhoodEstimated Value: $188,000 - $222,978
3
Beds
2
Baths
936
Sq Ft
$213/Sq Ft
Est. Value
About This Home
This home is located at 1039 N Butrick St, Waukegan, IL 60085 and is currently estimated at $199,245, approximately $212 per square foot. 1039 N Butrick St is a home located in Lake County with nearby schools including Whittier Elementary School, Edith M Smith Middle School, and Waukegan High School.
Ownership History
Date
Name
Owned For
Owner Type
Purchase Details
Closed on
Jun 14, 2011
Sold by
Lnv Corporation
Bought by
Lagunas Guadarrama Josefina
Current Estimated Value
Purchase Details
Closed on
Dec 16, 2010
Sold by
Martinez Jose and Case #10 Ch 708
Bought by
Lnv Corporation
Purchase Details
Closed on
Aug 11, 2000
Sold by
Sarver Stephan C and Adams Tanya I
Bought by
Martinez Jose
Home Financials for this Owner
Home Financials are based on the most recent Mortgage that was taken out on this home.
Original Mortgage
$114,008
Interest Rate
8.16%
Mortgage Type
FHA
Purchase Details
Closed on
Sep 28, 1998
Sold by
Hud
Bought by
Sarver Stephan C and Adams Tanya L
Home Financials for this Owner
Home Financials are based on the most recent Mortgage that was taken out on this home.
Original Mortgage
$85,295
Interest Rate
6.68%
Mortgage Type
FHA
Create a Home Valuation Report for This Property
The Home Valuation Report is an in-depth analysis detailing your home's value as well as a comparison with similar homes in the area
Home Values in the Area
Average Home Value in this Area
Purchase History
| Date | Buyer | Sale Price | Title Company |
|---|---|---|---|
| Lagunas Guadarrama Josefina | $40,000 | Freedom Title Corporation | |
| Lnv Corporation | -- | Premier Title | |
| Martinez Jose | $115,000 | -- | |
| Sarver Stephan C | -- | Stewart Title |
Source: Public Records
Mortgage History
| Date | Status | Borrower | Loan Amount |
|---|---|---|---|
| Previous Owner | Martinez Jose | $114,008 | |
| Previous Owner | Sarver Stephan C | $85,295 |
Source: Public Records
Tax History Compared to Growth
Tax History
| Year | Tax Paid | Tax Assessment Tax Assessment Total Assessment is a certain percentage of the fair market value that is determined by local assessors to be the total taxable value of land and additions on the property. | Land | Improvement |
|---|---|---|---|---|
| 2024 | $3,596 | $51,027 | $11,524 | $39,503 |
| 2023 | $3,730 | $46,135 | $10,419 | $35,716 |
| 2022 | $3,730 | $44,153 | $12,277 | $31,876 |
| 2021 | $3,198 | $36,679 | $10,735 | $25,944 |
| 2020 | $3,193 | $34,171 | $10,001 | $24,170 |
| 2019 | $3,161 | $31,312 | $9,164 | $22,148 |
| 2018 | $2,870 | $28,582 | $11,530 | $17,052 |
| 2017 | $2,744 | $25,287 | $10,201 | $15,086 |
| 2016 | $2,468 | $21,973 | $8,864 | $13,109 |
| 2015 | $2,309 | $19,666 | $7,933 | $11,733 |
| 2014 | $2,632 | $21,092 | $5,519 | $15,573 |
| 2012 | $3,481 | $22,853 | $5,980 | $16,873 |
Source: Public Records
Map
Nearby Homes
- 1000 Pine St
- 1105 Woodlawn Cir
- 1504 W Glen Flora Ave
- 1117 Judge Ave
- 968 Judge Ave
- 917 N Linden Ave
- 824 N Butrick St
- 1038 Indiana Ave
- 1019 N Lewis Ave
- 1005 N Lewis Ave
- 1335 Chestnut St
- 1110 N Ash St
- 1122 N Ash St
- 918 N Ash St
- 1336 N Ash St
- 12787 W Grove Ave
- 1018 W Atlantic Ave
- 620 N Poplar St
- 509 N Butrick St
- 1213 Grand Ave
- 1045 N Butrick St
- 1033 N Butrick St
- 1049 N Butrick St
- 1031 N Butrick St
- 1038 Pine St
- 1030 Pine St
- 1042 Pine St
- 1023 N Butrick St
- 1028 Pine St
- 1046 Pine St
- 1314 Highland Ave
- 1026 Pine St
- 1042 N Butrick St
- 1038 N Butrick St
- 1036 N Butrick St
- 1048 N Butrick St
- 1021 N Butrick St
- 1034 N Butrick St
- 1024 Pine St