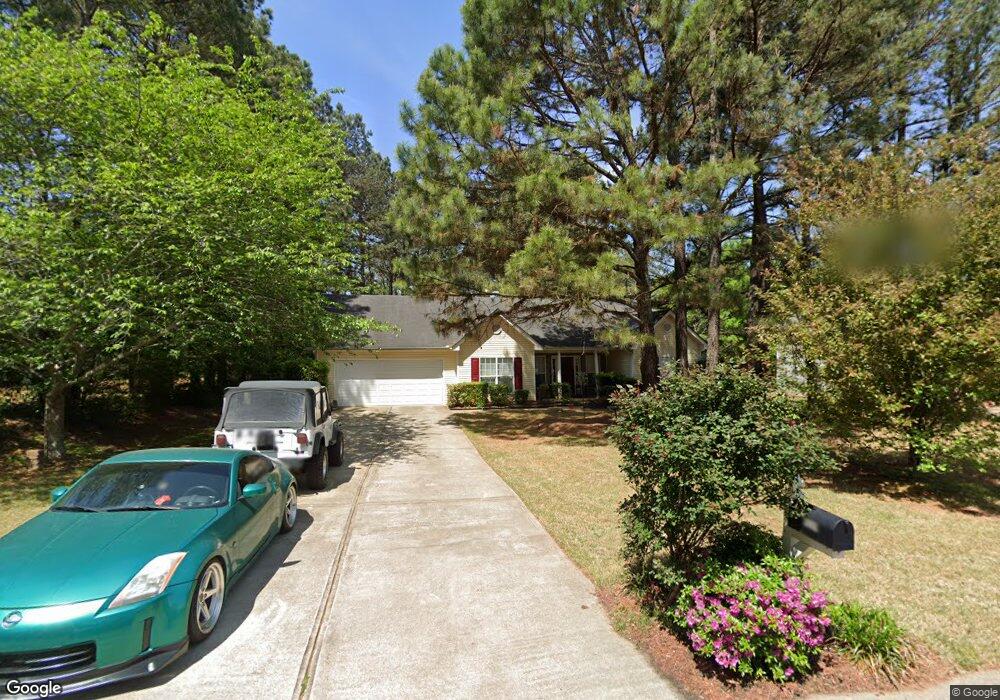
1039 Preserve Ln Unit 2 Bethlehem, GA 30620
Estimated Value: $290,000 - $330,000
--
Bed
2
Baths
1,572
Sq Ft
$202/Sq Ft
Est. Value
About This Home
This home is located at 1039 Preserve Ln Unit 2, Bethlehem, GA 30620 and is currently estimated at $317,889, approximately $202 per square foot. 1039 Preserve Ln Unit 2 is a home located in Barrow County with nearby schools including Yargo Elementary School, Haymon-Morris Middle School, and Apalachee High School.
Ownership History
Date
Name
Owned For
Owner Type
Purchase Details
Closed on
Aug 25, 2014
Sold by
Layton Mark D
Bought by
Morris James Brian
Current Estimated Value
Home Financials for this Owner
Home Financials are based on the most recent Mortgage that was taken out on this home.
Original Mortgage
$121,557
Outstanding Balance
$93,266
Interest Rate
4.2%
Mortgage Type
FHA
Estimated Equity
$224,623
Purchase Details
Closed on
Jun 27, 2002
Sold by
Southfork Homes
Bought by
Dinnen-Layton Kimberly B
Home Financials for this Owner
Home Financials are based on the most recent Mortgage that was taken out on this home.
Original Mortgage
$125,442
Interest Rate
6.67%
Mortgage Type
FHA
Purchase Details
Closed on
Jun 24, 2002
Sold by
Parkview Development
Bought by
Southfork Homes Inc
Home Financials for this Owner
Home Financials are based on the most recent Mortgage that was taken out on this home.
Original Mortgage
$125,442
Interest Rate
6.67%
Mortgage Type
FHA
Purchase Details
Closed on
May 2, 2000
Bought by
Parkview Development
Create a Home Valuation Report for This Property
The Home Valuation Report is an in-depth analysis detailing your home's value as well as a comparison with similar homes in the area
Home Values in the Area
Average Home Value in this Area
Purchase History
| Date | Buyer | Sale Price | Title Company |
|---|---|---|---|
| Morris James Brian | $123,800 | -- | |
| Dinnen-Layton Kimberly B | $126,500 | -- | |
| Southfork Homes Inc | $280,000 | -- | |
| Parkview Development | -- | -- |
Source: Public Records
Mortgage History
| Date | Status | Borrower | Loan Amount |
|---|---|---|---|
| Open | Morris James Brian | $121,557 | |
| Previous Owner | Dinnen-Layton Kimberly B | $125,442 |
Source: Public Records
Tax History Compared to Growth
Tax History
| Year | Tax Paid | Tax Assessment Tax Assessment Total Assessment is a certain percentage of the fair market value that is determined by local assessors to be the total taxable value of land and additions on the property. | Land | Improvement |
|---|---|---|---|---|
| 2024 | $2,800 | $110,746 | $25,200 | $85,546 |
| 2023 | $2,801 | $111,146 | $25,200 | $85,946 |
| 2022 | $2,311 | $78,269 | $20,000 | $58,269 |
| 2021 | $2,149 | $68,482 | $16,000 | $52,482 |
| 2020 | $1,922 | $60,766 | $16,000 | $44,766 |
| 2019 | $1,956 | $60,766 | $16,000 | $44,766 |
| 2018 | $1,849 | $57,966 | $13,200 | $44,766 |
| 2017 | $1,434 | $49,261 | $13,200 | $36,061 |
| 2016 | $1,380 | $42,994 | $13,200 | $29,794 |
| 2015 | $1,397 | $43,328 | $13,200 | $30,128 |
| 2014 | $1,242 | $36,930 | $6,468 | $30,462 |
| 2013 | -- | $35,010 | $6,468 | $28,542 |
Source: Public Records
Map
Nearby Homes
- 637 Sleeping Meadow Ln
- 286 Meadows Dr
- 0 Tanners Bridge Rd Unit 10588144
- 763 Moss Side Dr
- 0 Jb Owens Unit 7552902
- 0 Jb Owens Unit 7552891
- 0 Jb Owens Unit LOT 2 - 2.09 ACRES
- 0 Jb Owens Unit LOT 3 - 2.01 ACRES
- 1129 Loganville Hwy
- 103 Camp Ct
- 384 Winslow Ct
- 303 Ron Dr
- 209 Angie Way
- 934 Beaver Hill Dr
- 1071 Covenant Ct
- 1111 Otis Dr
- 190 Lokeys Ln
- 1381 Loganville Hwy
- 1164 Otis Dr
- 840 N Cross Lane Rd
- 1037 Preserve Ln Unit Two
- 1037 Preserve Ln Unit 2
- 1043 Preserve Ln Unit Two
- 1043 Preserve Ln Unit 2
- 1035 Preserve Ln Unit LOT 59
- 1035 Preserve Ln Unit 2
- 1107 Preserve Ln
- 772 Nature Trail
- 1040 Preserve Ln Unit 2
- 1045 Preserve Ln Unit Two
- 1045 Preserve Ln Unit 2
- 1036 Preserve Ln Unit LOT 23
- 1036 Preserve Ln
- 1033 Preserve Ln Unit Two
- 1033 Preserve Ln
- 1042 Preserve Ln Unit lot 52
- 1042 Preserve Ln
- 1044 Preserve Ln Unit 2
- 1046 Preserve Ln
- 903 Nature Trail