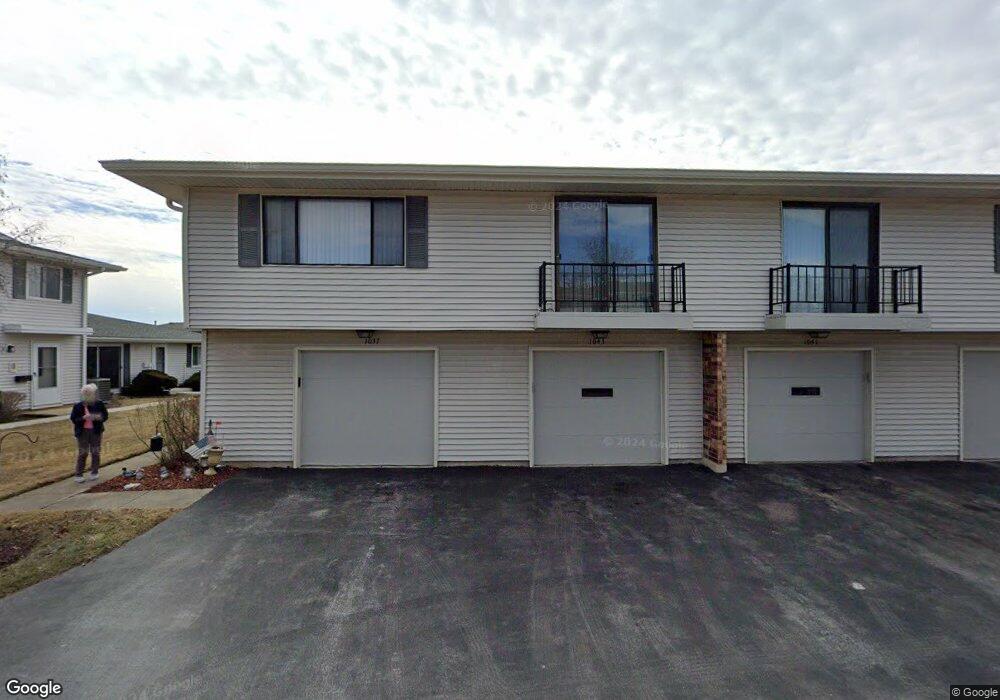
1039 Quanset Ct Unit 1851 Schaumburg, IL 60194
Hoover Park NeighborhoodEstimated Value: $234,923 - $254,000
3
Beds
--
Bath
--
Sq Ft
35.48
Acres
About This Home
This home is located at 1039 Quanset Ct Unit 1851, Schaumburg, IL 60194 and is currently estimated at $247,981. 1039 Quanset Ct Unit 1851 is a home located in Cook County with nearby schools including Enders-Salk Elementary School, Helen Keller Junior High School, and Schaumburg High School.
Ownership History
Date
Name
Owned For
Owner Type
Purchase Details
Closed on
May 22, 2013
Sold by
Bednarke Shirley A J
Bought by
Donaldson Brian
Current Estimated Value
Purchase Details
Closed on
Jan 7, 2002
Sold by
Bednarke Thomas J and Bednarke Shirley A
Bought by
Thomas J & Shirley A Bednarke Living Tr
Purchase Details
Closed on
Jan 26, 1993
Sold by
Charter Bank & Trust Of Illinois
Bought by
Bednarke Thomas J and Bednarke Shirley A
Home Financials for this Owner
Home Financials are based on the most recent Mortgage that was taken out on this home.
Original Mortgage
$54,600
Interest Rate
7.26%
Create a Home Valuation Report for This Property
The Home Valuation Report is an in-depth analysis detailing your home's value as well as a comparison with similar homes in the area
Home Values in the Area
Average Home Value in this Area
Purchase History
| Date | Buyer | Sale Price | Title Company |
|---|---|---|---|
| Donaldson Brian | $85,000 | None Available | |
| Thomas J & Shirley A Bednarke Living Tr | -- | -- | |
| Bednarke Thomas J | -- | -- |
Source: Public Records
Mortgage History
| Date | Status | Borrower | Loan Amount |
|---|---|---|---|
| Previous Owner | Bednarke Thomas J | $54,600 |
Source: Public Records
Tax History Compared to Growth
Tax History
| Year | Tax Paid | Tax Assessment Tax Assessment Total Assessment is a certain percentage of the fair market value that is determined by local assessors to be the total taxable value of land and additions on the property. | Land | Improvement |
|---|---|---|---|---|
| 2024 | $4,402 | $15,716 | $4,946 | $10,770 |
| 2023 | $4,269 | $15,716 | $4,946 | $10,770 |
| 2022 | $4,269 | $15,716 | $4,946 | $10,770 |
| 2021 | $3,685 | $12,159 | $6,336 | $5,823 |
| 2020 | $3,622 | $12,159 | $6,336 | $5,823 |
| 2019 | $3,623 | $13,517 | $6,336 | $7,181 |
| 2018 | $2,531 | $8,432 | $5,332 | $3,100 |
| 2017 | $2,491 | $8,432 | $5,332 | $3,100 |
| 2016 | $2,329 | $8,432 | $5,332 | $3,100 |
| 2015 | $2,134 | $7,134 | $4,636 | $2,498 |
| 2014 | $2,111 | $7,134 | $4,636 | $2,498 |
| 2013 | $2,057 | $7,134 | $4,636 | $2,498 |
Source: Public Records
Map
Nearby Homes
- 1123 Stoughton Ct Unit 1664
- 421 N Braintree Dr
- 501 Argyll Ln
- 225 Barcliffe Ln Unit 1011
- 1314 Colwyn Dr
- 104 N Braintree Dr
- 1425 Colwyn Dr
- 100 Ellington Dr
- 1125 Charlene Ln
- 365 Washington Blvd
- 640 Downey St
- 1321 Yarmouth Ct Unit 662
- 320 Pleasant St
- 645 Maywood Ln
- 585 Newark Ln
- 908 Jeffery Ct
- 700 N Hundley St
- 220 Kemah Ln
- 12 Stone Bridge Ct
- 510 Milan Ln
- 1041 Quanset Ct Unit 1852
- 1037 Quanset Ct Unit 1853
- 1043 Quanset Ct Unit 1854
- 1107 Quanset Ct Unit 1724
- 1033 Quanset Ct Unit 1842
- 1035 Quanset Ct Unit 1844
- 1029 Quanset Ct Unit 1843
- 1031 Quanset Ct Unit 1841
- 1105 Quanset Ct Unit 1722
- 1101 Quanset Ct Unit 1723
- 1101 Quanset Ct Unit 1101
- 1038 Quanset Ct Unit 1803
- 1036 Quanset Ct Unit 1801
- 1103 Quanset Ct Unit 1721
- 1104 Quanset Ct Unit 1794
- 1040 Quanset Ct Unit 4
- 1104 Stoughton Ct Unit 1714
- 1100 Stoughton Ct Unit 1711
- 1034 Quanset Ct Unit 1812
- 1032 Quanset Ct Unit 1814