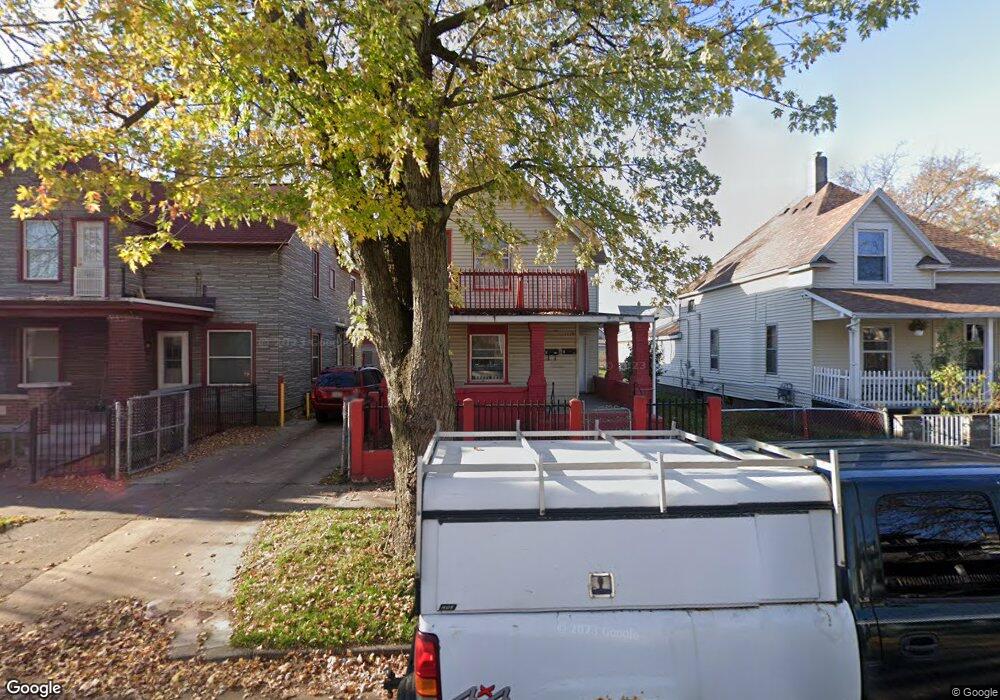
1039 Sheridan Ave SW Grand Rapids, MI 49503
Roosevelt Park NeighborhoodEstimated Value: $136,000 - $251,000
5
Beds
--
Bath
1,766
Sq Ft
$115/Sq Ft
Est. Value
About This Home
This home is located at 1039 Sheridan Ave SW, Grand Rapids, MI 49503 and is currently estimated at $203,924, approximately $115 per square foot. 1039 Sheridan Ave SW is a home located in Kent County with nearby schools including Cesar E. Chavez Elementary, Burton Middle School, and Union High School.
Ownership History
Date
Name
Owned For
Owner Type
Purchase Details
Closed on
May 14, 2021
Sold by
Rodriguez Nasarita Cavazos
Bought by
Briones Martinez Maclovio and Briones Torres Ma
Current Estimated Value
Purchase Details
Closed on
May 27, 2009
Sold by
Secretary Of Housing & Urban Development
Bought by
Jubentino Enrique
Purchase Details
Closed on
Sep 14, 2007
Sold by
Citimortgage Inc
Bought by
Hud
Purchase Details
Closed on
Mar 7, 2007
Sold by
Ramos Jacobo Martin
Bought by
Citimortgage Inc
Purchase Details
Closed on
Jan 26, 2004
Sold by
Rios Galacion and Rios Amanda
Bought by
Ramos Jacobo Martin
Home Financials for this Owner
Home Financials are based on the most recent Mortgage that was taken out on this home.
Original Mortgage
$89,294
Interest Rate
5.91%
Mortgage Type
FHA
Purchase Details
Closed on
Aug 15, 2000
Bought by
Rios Rios G and Rios A
Create a Home Valuation Report for This Property
The Home Valuation Report is an in-depth analysis detailing your home's value as well as a comparison with similar homes in the area
Home Values in the Area
Average Home Value in this Area
Purchase History
| Date | Buyer | Sale Price | Title Company |
|---|---|---|---|
| Briones Martinez Maclovio | -- | None Available | |
| Cavezos Rodriguez Nasarita | -- | None Available | |
| Jubentino Enrique | $17,000 | None Available | |
| Hud | -- | None Available | |
| Citimortgage Inc | $92,379 | None Available | |
| Ramos Jacobo Martin | $90,000 | -- | |
| Rios Rios G | $33,000 | -- |
Source: Public Records
Mortgage History
| Date | Status | Borrower | Loan Amount |
|---|---|---|---|
| Previous Owner | Ramos Jacobo Martin | $89,294 | |
| Closed | Briones Martinez Maclovio | $0 |
Source: Public Records
Tax History Compared to Growth
Tax History
| Year | Tax Paid | Tax Assessment Tax Assessment Total Assessment is a certain percentage of the fair market value that is determined by local assessors to be the total taxable value of land and additions on the property. | Land | Improvement |
|---|---|---|---|---|
| 2025 | $2,727 | $91,100 | $0 | $0 |
| 2024 | $2,727 | $80,800 | $0 | $0 |
| 2023 | $2,911 | $68,200 | $0 | $0 |
| 2022 | $3,654 | $53,700 | $0 | $0 |
| 2021 | $5,807 | $48,000 | $0 | $0 |
| 2020 | $1,986 | $41,900 | $0 | $0 |
| 2019 | $2,033 | $38,100 | $0 | $0 |
| 2018 | $1,020 | $27,200 | $0 | $0 |
| 2017 | $1,371 | $23,100 | $0 | $0 |
| 2016 | $1,293 | $22,500 | $0 | $0 |
| 2015 | $1,090 | $22,500 | $0 | $0 |
| 2013 | -- | $22,700 | $0 | $0 |
Source: Public Records
Map
Nearby Homes
- 962 Sheridan Ave SW
- 543 Tenhaaf Ct SW
- 841 Oakland Ave SW
- 730 Liberty St SW
- 721 Olympia St SW
- 125 Hall St SW
- 601 High St SW
- 47 Putnam St SW
- 719 Coate Ct SW
- 757 Tulip St SW
- 1265 Ionia Ave SW
- 26 Hall St SW
- 540 New Ave SW
- 530 New Ave SW
- 513 Crofton St SW
- 448 Pleasant St SW
- 444 Pleasant St SW
- 440 Pleasant St SW
- 436 Pleasant St SW
- 452 Pleasant St SW
- 1035 Sheridan Ave SW
- 1043 Sheridan Ave SW
- 1047 Sheridan Ave SW
- 1031 Sheridan Ave SW
- 1025 Sheridan Ave SW
- 1051 Sheridan Ave SW
- 1036 Caulfield Ave SW
- 1040 Caulfield Ave SW
- 1032 Caulfield Ave SW
- 1042 Caulfield Ave SW
- 1028 Caulfield Ave SW
- 1046 Caulfield Ave SW
- 1023 Sheridan Ave SW
- 1023 Sheridan Ave SW Unit 2upper
- 1053 Sheridan Ave SW
- 1021 Sheridan Ave SW
- 1021 Sheridan Ave SW
- 1026 Caulfield Ave SW
- 1048 Caulfield Ave SW
- 1036 Sheridan Ave SW