10391 Flat Stone Loop Bonita Springs, FL 34135
Council NeighborhoodEstimated Value: $467,455 - $613,000
3
Beds
2
Baths
2,474
Sq Ft
$227/Sq Ft
Est. Value
About This Home
This home is located at 10391 Flat Stone Loop, Bonita Springs, FL 34135 and is currently estimated at $560,364, approximately $226 per square foot. 10391 Flat Stone Loop is a home located in Lee County with nearby schools including Bonita Springs Elementary School, Spring Creek Elementary School, and Pinewoods Elementary School.
Ownership History
Date
Name
Owned For
Owner Type
Purchase Details
Closed on
Apr 13, 2024
Sold by
Sawicki William H and Sawicki Betty J
Bought by
William H Sawicki Revocable Trust and Betty Jane Sawicki Revocable Trust
Current Estimated Value
Purchase Details
Closed on
Feb 23, 2010
Sold by
Fannie Mae
Bought by
Sawicki William H and Sawicki Betty J
Purchase Details
Closed on
Feb 8, 2010
Sold by
Nationstar Mortgage Llc
Bought by
Federal National Mortgage Association
Purchase Details
Closed on
Oct 20, 2009
Sold by
Swift Sharon A and Swift Tony
Bought by
Nationstar Mortgage Llc
Purchase Details
Closed on
Mar 29, 2007
Sold by
Centex Homes
Bought by
Swift Tony and Swift Sharon A
Home Financials for this Owner
Home Financials are based on the most recent Mortgage that was taken out on this home.
Original Mortgage
$312,900
Interest Rate
6.27%
Mortgage Type
Unknown
Create a Home Valuation Report for This Property
The Home Valuation Report is an in-depth analysis detailing your home's value as well as a comparison with similar homes in the area
Home Values in the Area
Average Home Value in this Area
Purchase History
| Date | Buyer | Sale Price | Title Company |
|---|---|---|---|
| William H Sawicki Revocable Trust | $100 | None Listed On Document | |
| Sawicki William H | $210,000 | Attorney | |
| Federal National Mortgage Association | -- | Attorney | |
| Nationstar Mortgage Llc | $307,000 | Attorney | |
| Swift Tony | $391,200 | Commerce Title Company |
Source: Public Records
Mortgage History
| Date | Status | Borrower | Loan Amount |
|---|---|---|---|
| Previous Owner | Swift Tony | $312,900 |
Source: Public Records
Tax History Compared to Growth
Tax History
| Year | Tax Paid | Tax Assessment Tax Assessment Total Assessment is a certain percentage of the fair market value that is determined by local assessors to be the total taxable value of land and additions on the property. | Land | Improvement |
|---|---|---|---|---|
| 2025 | $5,483 | $406,047 | -- | -- |
| 2024 | $5,483 | $369,134 | -- | -- |
| 2023 | $5,334 | $335,576 | $0 | $0 |
| 2022 | $4,633 | $305,069 | $0 | $0 |
| 2021 | $4,106 | $277,335 | $63,075 | $214,260 |
| 2020 | $3,975 | $260,029 | $61,900 | $198,129 |
| 2019 | $4,034 | $262,423 | $55,525 | $206,898 |
| 2018 | $4,095 | $264,055 | $55,525 | $208,530 |
| 2017 | $4,225 | $265,667 | $55,000 | $210,667 |
| 2016 | $4,285 | $270,772 | $55,000 | $215,772 |
| 2015 | $4,048 | $251,605 | $52,500 | $199,105 |
| 2014 | $3,682 | $223,497 | $49,000 | $174,497 |
| 2013 | -- | $195,398 | $40,000 | $155,398 |
Source: Public Records
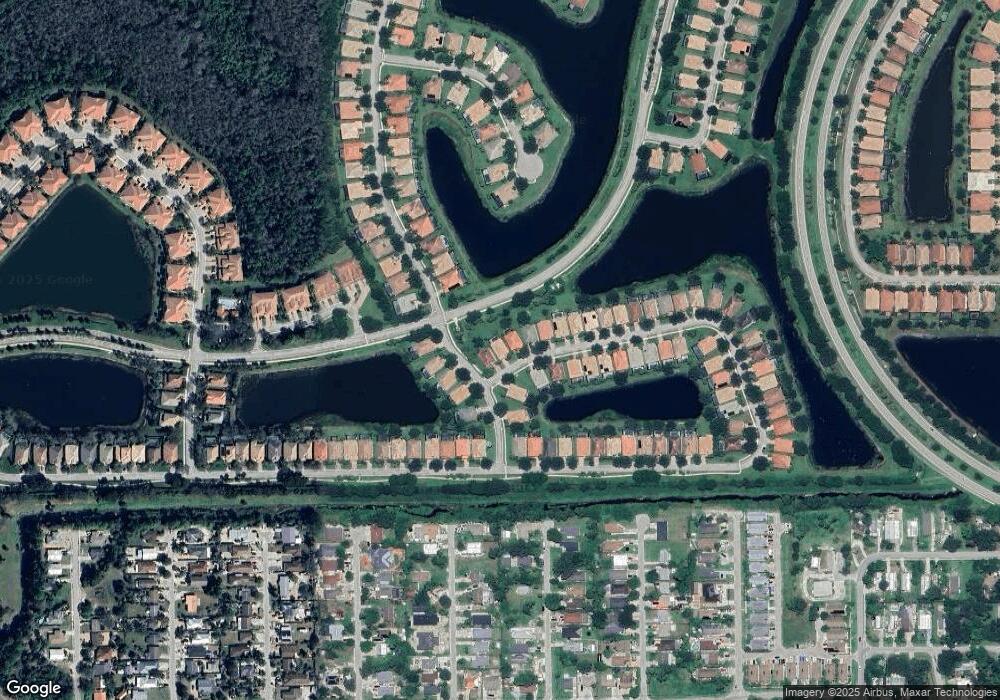
Map
Nearby Homes
- 10312 Flat Stone Loop
- 10240 Cobble Notch Loop Unit 201
- 10240 Cobble Notch Loop Unit 202
- 10320 Wishing Stone Ct
- 26502 Lucky Stone Rd Unit 101
- 10230 Cobble Hill Rd
- 26485 Lucky Stone Rd Unit 202
- 11157 Monte Carlo Blvd
- 26479 Lucky Stone Rd Unit 202
- 26341 Stonewall Ln
- 11051 Wagon Trail
- 26650 Coventry Ln
- 26448 Lucky Stone Rd Unit 202
- 26254 Prince Pierre Way
- 26425 Lucky Stone Rd Unit 201
- 26414 Lucky Stone Rd Unit 101
- 10393 Flat Stone Loop
- 10389 Flat Stone Loop
- 10392 Flat Stone Loop
- 10387 Flat Stone Loop
- 26488 Doverstone St
- 10385 Flat Stone Loop
- 26486 Doverstone St
- 10386 Flat Stone Loop
- 26484 Doverstone St
- 26491 Doverstone St
- 10383 Flat Stone Loop
- 10384 Flat Stone Loop
- 26490 Doverstone St Unit 37
- 26482 Doverstone St
- 26477 Doverstone St
- 10382 Flat Stone Loop
- 10381 Flat Stone Loop
- 10380 Flat Stone Loop
- 10379 Flat Stone Loop
- 26475 Doverstone St