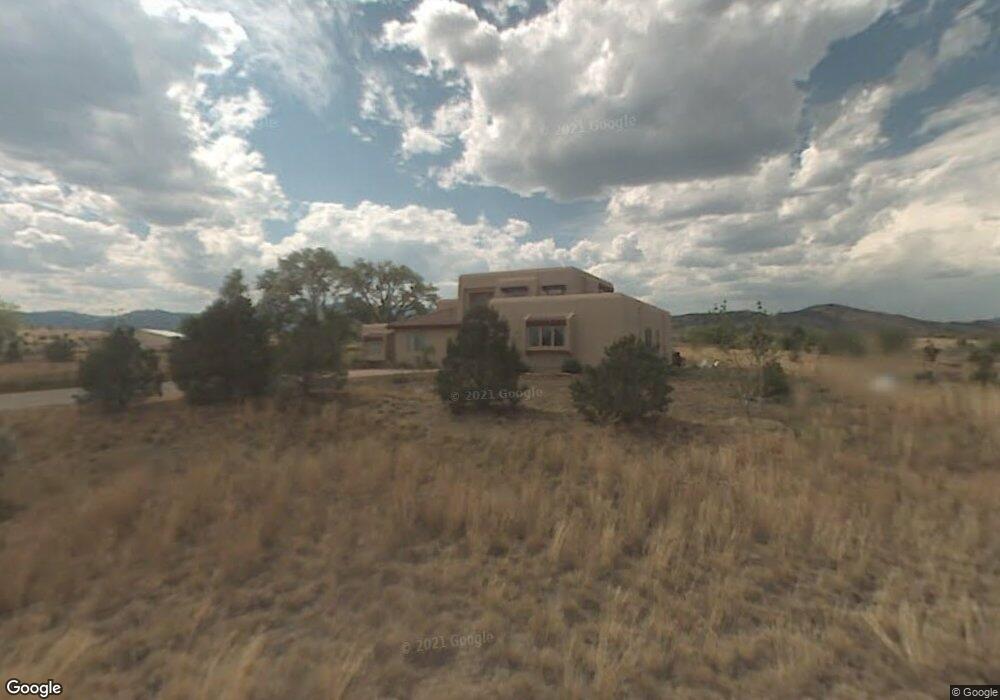
10391 Galatia Ct Longmont, CO 80503
Estimated Value: $1,737,000 - $2,066,000
4
Beds
4
Baths
3,597
Sq Ft
$518/Sq Ft
Est. Value
About This Home
This home is located at 10391 Galatia Ct, Longmont, CO 80503 and is currently estimated at $1,862,792, approximately $517 per square foot. 10391 Galatia Ct is a home located in Boulder County with nearby schools including Blue Mountain Elementary School, Altona Middle School, and Silver Creek High School.
Ownership History
Date
Name
Owned For
Owner Type
Purchase Details
Closed on
Mar 21, 2006
Sold by
Yost Gary F and Yost Ann B
Bought by
Andrews Donald J and Andrews Karen M
Current Estimated Value
Home Financials for this Owner
Home Financials are based on the most recent Mortgage that was taken out on this home.
Original Mortgage
$351,350
Outstanding Balance
$199,037
Interest Rate
6.21%
Mortgage Type
Fannie Mae Freddie Mac
Estimated Equity
$1,663,755
Purchase Details
Closed on
Oct 17, 1995
Sold by
Yost Gary F and Yost Ann B
Bought by
Yost Gary F
Home Financials for this Owner
Home Financials are based on the most recent Mortgage that was taken out on this home.
Original Mortgage
$155,000
Interest Rate
7.62%
Purchase Details
Closed on
Dec 16, 1994
Sold by
Bagnell Glade N and Bagnell Marilyn J
Bought by
Yost Gary F
Home Financials for this Owner
Home Financials are based on the most recent Mortgage that was taken out on this home.
Original Mortgage
$92,500
Interest Rate
9.07%
Mortgage Type
Seller Take Back
Create a Home Valuation Report for This Property
The Home Valuation Report is an in-depth analysis detailing your home's value as well as a comparison with similar homes in the area
Home Values in the Area
Average Home Value in this Area
Purchase History
| Date | Buyer | Sale Price | Title Company |
|---|---|---|---|
| Andrews Donald J | $776,345 | Land Title Guarantee Company | |
| Yost Gary F | -- | Land Title | |
| Yost Gary F | $117,500 | -- |
Source: Public Records
Mortgage History
| Date | Status | Borrower | Loan Amount |
|---|---|---|---|
| Open | Andrews Donald J | $351,350 | |
| Previous Owner | Yost Gary F | $155,000 | |
| Previous Owner | Yost Gary F | $92,500 |
Source: Public Records
Tax History Compared to Growth
Tax History
| Year | Tax Paid | Tax Assessment Tax Assessment Total Assessment is a certain percentage of the fair market value that is determined by local assessors to be the total taxable value of land and additions on the property. | Land | Improvement |
|---|---|---|---|---|
| 2025 | $9,326 | $85,175 | $19,544 | $65,631 |
| 2024 | $9,326 | $85,175 | $19,544 | $65,631 |
| 2023 | $9,167 | $97,103 | $13,172 | $87,616 |
| 2022 | $10,415 | $106,300 | $12,079 | $94,221 |
| 2021 | $10,438 | $109,360 | $12,427 | $96,933 |
| 2020 | $5,950 | $63,735 | $14,300 | $49,435 |
| 2019 | $5,850 | $63,735 | $14,300 | $49,435 |
| 2018 | $5,014 | $54,950 | $14,400 | $40,550 |
| 2017 | $4,887 | $60,751 | $15,920 | $44,831 |
| 2016 | $6,072 | $67,676 | $20,218 | $47,458 |
| 2015 | $5,565 | $56,993 | $20,457 | $36,536 |
| 2014 | $5,533 | $56,993 | $20,457 | $36,536 |
Source: Public Records
Map
Nearby Homes
- 10619 N 65th St
- 5101 Saint Vrain Rd
- 6880 Saint Vrain Rd
- 11558 Eagle Springs Trail
- 11562 Eagle Springs Trail
- 7373 Nelson Rd
- 10077 N 75th St
- 6231 Prospect Rd
- 150 N 75th St
- 8586 N 55th St
- 9231 Tollgate Dr
- 733 Kubat Ln Unit B
- 5595 Wheaton Ave
- 11730 Pointe View Dr
- 729 Kubat Ln Unit A
- 750 Kubat Ln Unit B
- 751 W Grange Ct Unit A
- 8418 Stirrup Ln
- 1106 Redbud Cir
- 5717 Four Leaf Dr
- 10365 Galatia Ct
- 5800 Galatia Rd
- 10333 Galatia Ct
- 5629 Galatia Rd
- 5901 Galatia Rd
- 5680 Saint Vrain Rd
- 10345 Macedonia St
- 10329 Macedonia St
- 10381 Macedonia St
- 10293 Macedonia St
- 10261 Macedonia St
- 10219 Macedonia St
- 5410 Saint Vrain Rd
- 6217 Corinth Rd
- 6215 Ephesus Rd
- 10394 Macedonia St
- 10350 Macedonia St
- 10322 Macedonia St
- 10272 Macedonia St
- 6233 Ephesus Rd