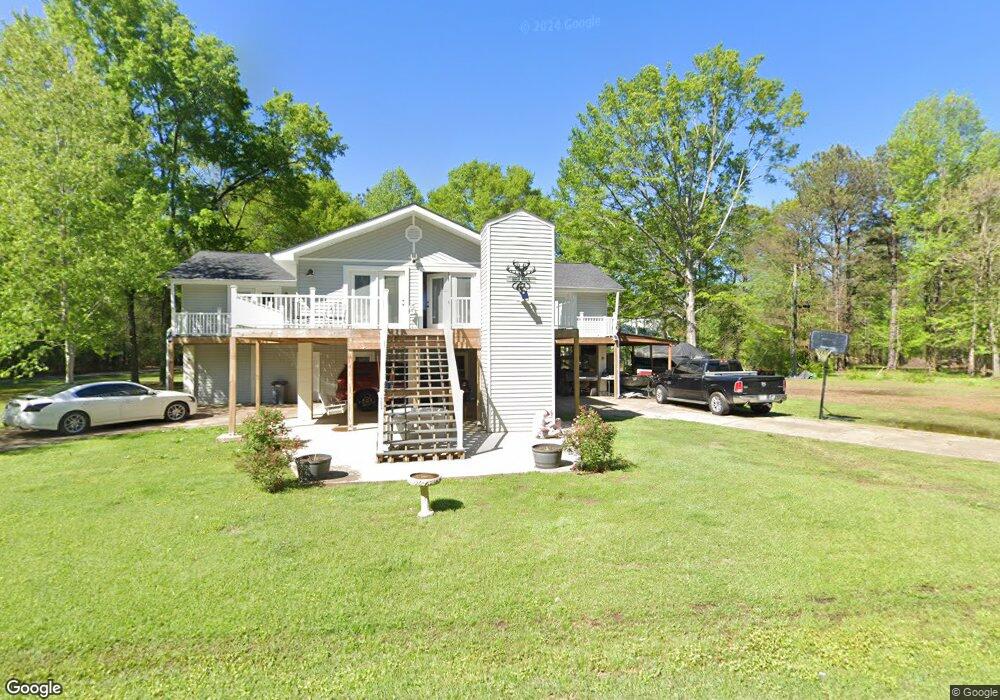
10395 Myra Dr West Point, MS 39773
Estimated Value: $228,136 - $376,000
4
Beds
--
Bath
2,956
Sq Ft
$94/Sq Ft
Est. Value
About This Home
This home is located at 10395 Myra Dr, West Point, MS 39773 and is currently estimated at $277,284, approximately $93 per square foot. 10395 Myra Dr is a home located in Clay County with nearby schools including East Side Elementary School, West Clay Elementary School, and Church Hill Elementary School.
Ownership History
Date
Name
Owned For
Owner Type
Purchase Details
Closed on
Jun 29, 2021
Sold by
Holmes Randy and Holmes Heather S
Bought by
Holmes Randy and Holmes Heather S
Current Estimated Value
Purchase Details
Closed on
Jan 17, 2020
Sold by
Craft Christopher Lee and Craft Jennifer
Bought by
Holmes Randy
Home Financials for this Owner
Home Financials are based on the most recent Mortgage that was taken out on this home.
Original Mortgage
$195,000
Outstanding Balance
$171,154
Interest Rate
3.7%
Mortgage Type
VA
Estimated Equity
$106,130
Purchase Details
Closed on
Jul 6, 2018
Sold by
Wright Kenneth and Wright Jennifer Lauren
Bought by
Craft Christopher Lee and Craft Cheryl
Home Financials for this Owner
Home Financials are based on the most recent Mortgage that was taken out on this home.
Original Mortgage
$195,395
Interest Rate
4.5%
Mortgage Type
FHA
Create a Home Valuation Report for This Property
The Home Valuation Report is an in-depth analysis detailing your home's value as well as a comparison with similar homes in the area
Purchase History
| Date | Buyer | Sale Price | Title Company |
|---|---|---|---|
| Holmes Randy | -- | None Available | |
| Holmes Randy | -- | -- | |
| Craft Christopher Lee | -- | -- |
Source: Public Records
Mortgage History
| Date | Status | Borrower | Loan Amount |
|---|---|---|---|
| Open | Holmes Randy | $195,000 | |
| Previous Owner | Craft Christopher Lee | $195,395 |
Source: Public Records
Tax History
| Year | Tax Paid | Tax Assessment Tax Assessment Total Assessment is a certain percentage of the fair market value that is determined by local assessors to be the total taxable value of land and additions on the property. | Land | Improvement |
|---|---|---|---|---|
| 2025 | -- | $15,250 | $1,000 | $14,250 |
| 2024 | -- | $15,250 | $1,000 | $14,250 |
| 2023 | $1,404 | $15,250 | $1,000 | $14,250 |
| 2022 | $0 | $15,250 | $1,000 | $14,250 |
| 2021 | $0 | $15,250 | $1,000 | $14,250 |
| 2020 | $693 | $15,250 | $1,000 | $14,250 |
| 2019 | $645 | $15,121 | $1,000 | $14,121 |
| 2018 | $612 | $15,121 | $1,000 | $14,121 |
| 2017 | $612 | $15,121 | $1,000 | $14,121 |
| 2016 | $586 | $15,121 | $1,000 | $14,121 |
| 2015 | $574 | $14,377 | $1,000 | $13,377 |
| 2014 | $1,009 | $14,377 | $1,000 | $13,377 |
| 2013 | $1,009 | $14,377 | $1,000 | $13,377 |
Source: Public Records
Map
Nearby Homes
- 120 Nelda Dr
- 0 Riverchase Dr
- 0 Officers Lake Rd
- 1873 Sandy Land Rd
- Lot 1 Old Waverly Rd
- 145 Brownlee Dr
- 774 River Oaks Dr
- 45 Greenleaf Ln
- 1372 Mike Parra Rd
- 112 Steeplechase Dr
- 1 Sleepy Hollow Dr
- 0 Benttree Trail
- 0 Mississippi 373
- 0 Downs Rd
- 81 Azalea Trail
- 134 S Perkins Rd
- 4193 Highway 45 N
- 94 Huckleberry Dr
- 0 Hickory Ridge
- 6117 Highway 45 N
- 10341 Myra Dr
- 10357 Myra Dr
- 1008 Britt Rd
- 1006 Britt Rd
- 1004 Britt Rd
- 1002 Britt Rd
- 1946 London Chapel Rd
- 10557 Melba Dr
- 10507 Melba Dr
- 10575 Melba Dr
- 10590 Melba Dr
- 0 Humphries Cove Rd
- 376 Humphries Cove Rd
- 323 Humphries Cove Rd
- 10465 Nelda Dr
- 10465 Nelda Dr
- 466 Humphries Cove Rd
- 115 Mallard Point Dr
- 10608 Mallard Point
- 10636 Mallard Point
Your Personal Tour Guide
Ask me questions while you tour the home.