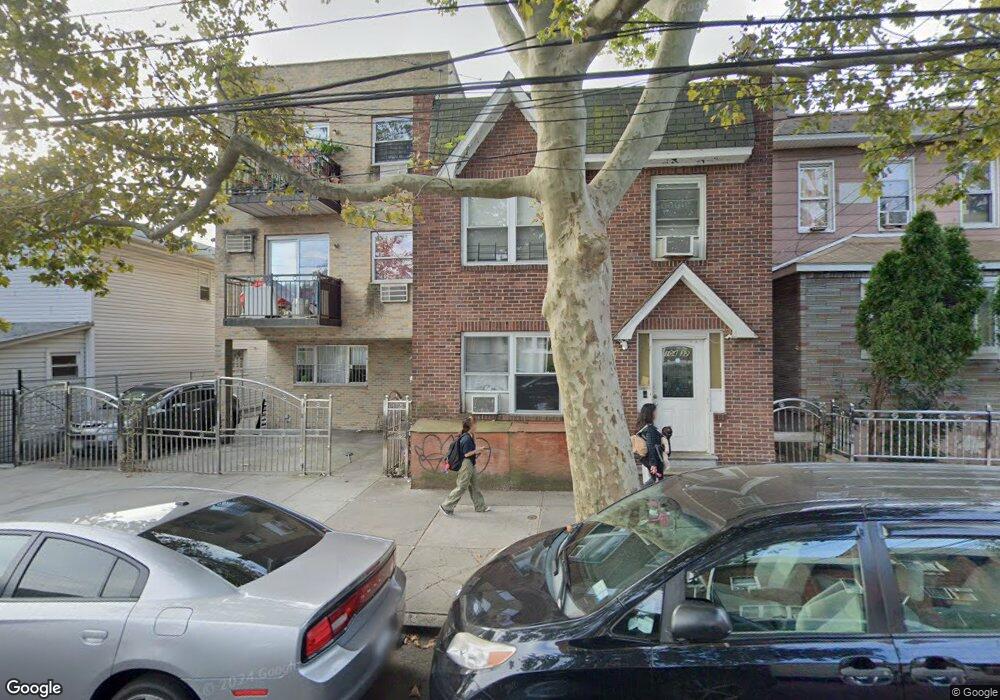
104-32 46th Ave Flushing, NY 11368
Corona NeighborhoodEstimated Value: $1,012,000 - $1,079,000
Studio
--
Bath
1,608
Sq Ft
$648/Sq Ft
Est. Value
About This Home
This home is located at 104-32 46th Ave, Flushing, NY 11368 and is currently estimated at $1,042,333, approximately $648 per square foot. 104-32 46th Ave is a home located in Queens County with nearby schools including Is 61 Leonardo Da Vinci, Flushing High School, and St. Leo Elementary School.
Ownership History
Date
Name
Owned For
Owner Type
Purchase Details
Closed on
Nov 19, 2014
Sold by
Chang Hsiao Ming and Guo Fei
Bought by
Lin Gui Zhen and Zhu Zhong Qing
Current Estimated Value
Purchase Details
Closed on
Mar 15, 2013
Sold by
Guo Fei
Bought by
Chang Hsiao Ming and Guo Fei
Purchase Details
Closed on
Mar 4, 2010
Sold by
Guo Fei
Bought by
Guo Fei
Purchase Details
Closed on
Mar 13, 2007
Sold by
Leda Ruschmeier Executrix and Leda Ruschmeier Lina Cappelletti
Bought by
Guo Fei
Home Financials for this Owner
Home Financials are based on the most recent Mortgage that was taken out on this home.
Original Mortgage
$134,950
Interest Rate
6.33%
Purchase Details
Closed on
Nov 10, 2006
Sold by
Secretary Of Housing & Urban Development
Bought by
Noble Nasir
Home Financials for this Owner
Home Financials are based on the most recent Mortgage that was taken out on this home.
Original Mortgage
$99,995
Interest Rate
6.39%
Create a Home Valuation Report for This Property
The Home Valuation Report is an in-depth analysis detailing your home's value as well as a comparison with similar homes in the area
Home Values in the Area
Average Home Value in this Area
Purchase History
| Date | Buyer | Sale Price | Title Company |
|---|---|---|---|
| Lin Gui Zhen | $610,000 | -- | |
| Lin Gui Zhen | $610,000 | -- | |
| Chang Hsiao Ming | -- | -- | |
| Chang Hsiao Ming | -- | -- | |
| Guo Fei | -- | -- | |
| Guo Fei | -- | -- | |
| Guo Fei | $900,000 | -- | |
| Guo Fei | $900,000 | -- | |
| Noble Nasir | $499,999 | -- | |
| Noble Nasir | $499,999 | -- |
Source: Public Records
Mortgage History
| Date | Status | Borrower | Loan Amount |
|---|---|---|---|
| Previous Owner | Guo Fei | $134,950 | |
| Previous Owner | Guo Fei | $675,000 | |
| Previous Owner | Noble Nasir | $99,995 | |
| Previous Owner | Noble Nasir | $399,995 |
Source: Public Records
Tax History
| Year | Tax Paid | Tax Assessment Tax Assessment Total Assessment is a certain percentage of the fair market value that is determined by local assessors to be the total taxable value of land and additions on the property. | Land | Improvement |
|---|---|---|---|---|
| 2025 | $8,083 | $42,659 | $8,801 | $33,858 |
| 2024 | $8,083 | $40,244 | $8,687 | $31,557 |
| 2023 | $8,029 | $39,974 | $8,061 | $31,913 |
| 2022 | $8,112 | $57,540 | $11,760 | $45,780 |
| 2021 | $7,930 | $50,100 | $11,760 | $38,340 |
| 2020 | $7,525 | $44,460 | $11,760 | $32,700 |
| 2019 | $7,016 | $48,720 | $11,760 | $36,960 |
| 2018 | $6,969 | $33,312 | $8,446 | $24,866 |
| 2017 | $6,785 | $33,285 | $9,825 | $23,460 |
| 2016 | $6,277 | $33,285 | $9,825 | $23,460 |
Source: Public Records
Map
Nearby Homes
- 10444 47th Ave
- 104-20 47th Ave
- 104-04 47th Ave Unit 2C
- 43-12 104th St
- 10603 49th Ave
- 104-49 49th Ave
- 10605 49th Ave
- 107-47 49th Ave
- 10237 Nicolls Ave
- 102-48 Nicolls Ave
- 104-28 42nd Ave
- 108-19 48th Ave
- 10311 Corona Ave
- 10309 Corona Ave
- 10307 Corona Ave
- 108-25 48th Ave
- 103-07 Corona Ave
- 108-23 44th Ave
- 10205 46th Ave
- 104-39 42nd Ave
- 104-32 46th Ave Unit 2
- 10432 46th Ave
- 10430 46th Ave
- 10436 46th Ave
- 10428 46th Ave
- 10438 46th Ave
- 104-24 46th Ave Unit 2B
- 104-24 46th Ave Unit 1B
- 104-24 46th Ave Unit 3-B
- 104-24 46th Ave
- 10440 46th Ave
- 10422 46th Ave Unit 3B
- 10422 46th Ave Unit 3A
- 10422 46th Ave Unit 2B
- 10422 46th Ave Unit 2A
- 10422 46th Ave Unit 1B
- 10422 46th Ave Unit 1A
- 10422 46th Ave
- 10424 46th Ave Unit 3A
- 10424 46th Ave Unit 2B
Your Personal Tour Guide
Ask me questions while you tour the home.