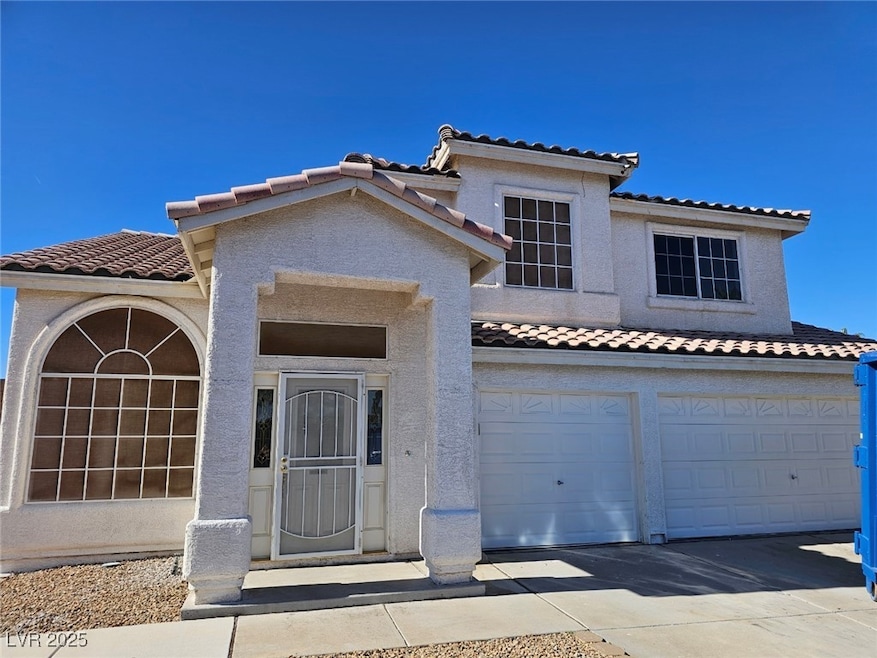
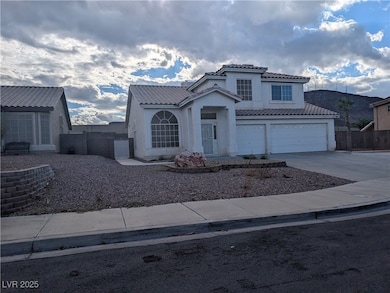


104 Appian Way Henderson, NV 89002
Highland Hills NeighborhoodEstimated payment $3,592/month
Highlights
- Covered RV Parking
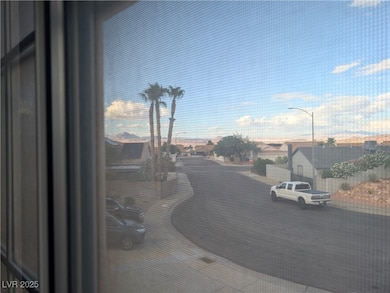
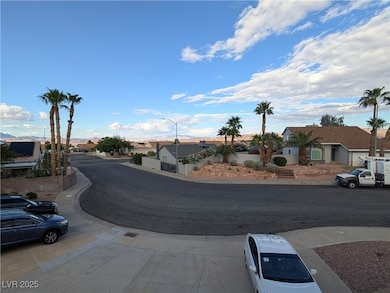
- Mountain View
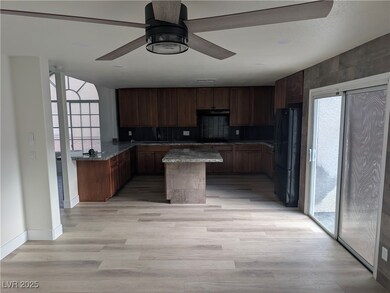
- Great Room
- Jack & Terry Mannion Middle School Rated 9+
- Main Floor Bedroom
- No HOA
About This Home
Fully updated House has auto lift and workshop. All the kitchen and Bathrooms are custom. Unique property. External connection for electric including 220 volt. Room for many cars. Former owner did high end auto restoration. has built in car lift and car repair building. Lots of parking and room for an RV. NO HOA.
Listing Agent
Properties Plus Referral Netwo Brokerage Phone: 702-595-4441 License #S.0176058 Listed on: 10/01/2025
Home Details
Home Type
- Single Family
Est. Annual Taxes
- $2,003
Year Built
- Built in 1994
Lot Details
- 8,276 Sq Ft Lot
- East Facing Home
- Back Yard Fenced
- Block Wall Fence
- Artificial Turf
Parking
- 2 Car Attached Garage
- 1 Detached Carport Space
- Covered RV Parking
Home Design
- Tile Roof
- Stucco
Interior Spaces
- 1,983 Sq Ft Home
- 2-Story Property
- Partially Furnished
- Ceiling Fan
- Electric Fireplace
- Tinted Windows
- Window Treatments
- Great Room
- Ceramic Tile Flooring
- Mountain Views
Kitchen
- Built-In Electric Oven
- Electric Cooktop
- Microwave
- Dishwasher
- Disposal
Bedrooms and Bathrooms
- 4 Bedrooms
- Main Floor Bedroom
- 3 Bathrooms
Laundry
- Laundry on main level
- Dryer
- Washer
Eco-Friendly Details
- Energy-Efficient Windows
Outdoor Features
- Separate Outdoor Workshop
- Outbuilding
Schools
- Galloway Elementary School
- Mannion Jack & Terry Middle School
- Foothill High School
Utilities
- Two cooling system units
- Central Heating and Cooling System
- 220 Volts in Garage
- Water Heater
Community Details
- No Home Owners Association
- Greenway Gardens #7 Lewis Homes Subdivision
Map
Home Values in the Area
Average Home Value in this Area
Tax History
| Year | Tax Paid | Tax Assessment Tax Assessment Total Assessment is a certain percentage of the fair market value that is determined by local assessors to be the total taxable value of land and additions on the property. | Land | Improvement |
|---|---|---|---|---|
| 2025 | $2,003 | $86,099 | $28,000 | $58,099 |
| 2024 | $1,945 | $86,099 | $28,000 | $58,099 |
| 2023 | $1,945 | $93,319 | $37,800 | $55,519 |
| 2022 | $1,889 | $80,673 | $29,750 | $50,923 |
| 2021 | $1,834 | $74,214 | $25,550 | $48,664 |
| 2020 | $1,777 | $73,270 | $24,850 | $48,420 |
| 2019 | $1,725 | $68,670 | $21,000 | $47,670 |
| 2018 | $1,675 | $64,712 | $18,900 | $45,812 |
| 2017 | $1,796 | $61,955 | $15,400 | $46,555 |
| 2016 | $1,587 | $60,984 | $14,000 | $46,984 |
| 2015 | $1,583 | $55,272 | $8,750 | $46,522 |
| 2014 | $1,534 | $51,379 | $8,750 | $42,629 |
Property History
| Date | Event | Price | List to Sale | Price per Sq Ft |
|---|---|---|---|---|
| 10/01/2025 10/01/25 | For Sale | $649,900 | -- | $328 / Sq Ft |
Purchase History
| Date | Type | Sale Price | Title Company |
|---|---|---|---|
| Bargain Sale Deed | -- | Lawyers Title | |
| Bargain Sale Deed | $495,000 | Lawyers Title | |
| Grant Deed | $170,000 | Pacific Coast Title | |
| Trustee Deed | $116,391 | Pacific Coast Title | |
| Bargain Sale Deed | $359,900 | Fidelity National Title | |
| Bargain Sale Deed | $349,900 | First Amer Title Co Of Nv | |
| Interfamily Deed Transfer | -- | National Title Company | |
| Interfamily Deed Transfer | -- | National Title Company | |
| Grant Deed | $128,000 | First American Title Company |
Mortgage History
| Date | Status | Loan Amount | Loan Type |
|---|---|---|---|
| Open | $396,000 | New Conventional | |
| Previous Owner | $153,000 | New Conventional | |
| Previous Owner | $53,900 | Stand Alone Second | |
| Previous Owner | $297,000 | Fannie Mae Freddie Mac | |
| Previous Owner | $176,250 | New Conventional | |
| Previous Owner | $123,291 | FHA |
Source: Las Vegas REALTORS®
MLS Number: 2723537
APN: 179-30-210-005
Disclaimer: Certain information contained herein is derived from information provided by parties other than Homes.com. All information provided is deemed reliable, but is not guaranteed to be accurate and should be independently verified.
![]() The data relating to real estate for sale on this web site comes in part from the INTERNET DATA EXCHANGE Program of the Greater Las Vegas Association of REALTORS® MLS. Real estate listings held by brokerage firms other than this site owner are marked with the IDX logo. Information is deemed reliable but not guaranteed. Copyright 2025 of the Greater Las Vegas Association of REALTORS® MLS. All rights reserved.
The data relating to real estate for sale on this web site comes in part from the INTERNET DATA EXCHANGE Program of the Greater Las Vegas Association of REALTORS® MLS. Real estate listings held by brokerage firms other than this site owner are marked with the IDX logo. Information is deemed reliable but not guaranteed. Copyright 2025 of the Greater Las Vegas Association of REALTORS® MLS. All rights reserved.
- 114 E Tamarack Dr
- 736 Yellowtail Way
- 722 Barrie Ct
- 128 Rancho Maderas Way
- 805 Blue Springs Dr
- 805 Lupine Ct
- 133 Park Ridge Ln
- 131 Park Ridge Ln
- 692 Skyline Rd
- 815 Sun Bridge Ln
- 805 Jasmine Ct
- 730 Descartes Ave
- 204 Cimarron Ct
- 848 Coral Cottage Dr
- 815 Crabapple Dr
- 854 Coral Cottage Dr
- 107 Mint Orchard Dr
- 860 Bergamont Dr
- 784 Tossa de Mar Ave
- 121 E Rancho Dr
- 131 E Tamarack Dr
- 682 Ladywood Ln
- 214 Appian Way
- 750 Vortex Ave
- 838 Rusty Anchor Way
- 841 Rusty Anchor Way Unit 41
- 177 Laguna Hills Ct
- 57 Voltaire Ave
- 200 W Desert Rose Dr
- 425 Golden Valley Dr
- 231 W Horizon Ridge Pkwy
- 25 Precipice Ct
- 1012 Desert Retreat Ct
- 403 Royal Greens Dr
- 231 W Horizon Ridge Pkwy Unit 1224
- 231 W Horizon Ridge Pkwy Unit 1913
- 231 W Horizon Ridge Pkwy Unit 728
- 252 Walsh Peak Ave
- 291 Fletcher Falls St
- 334 Laurel Peak Dr
