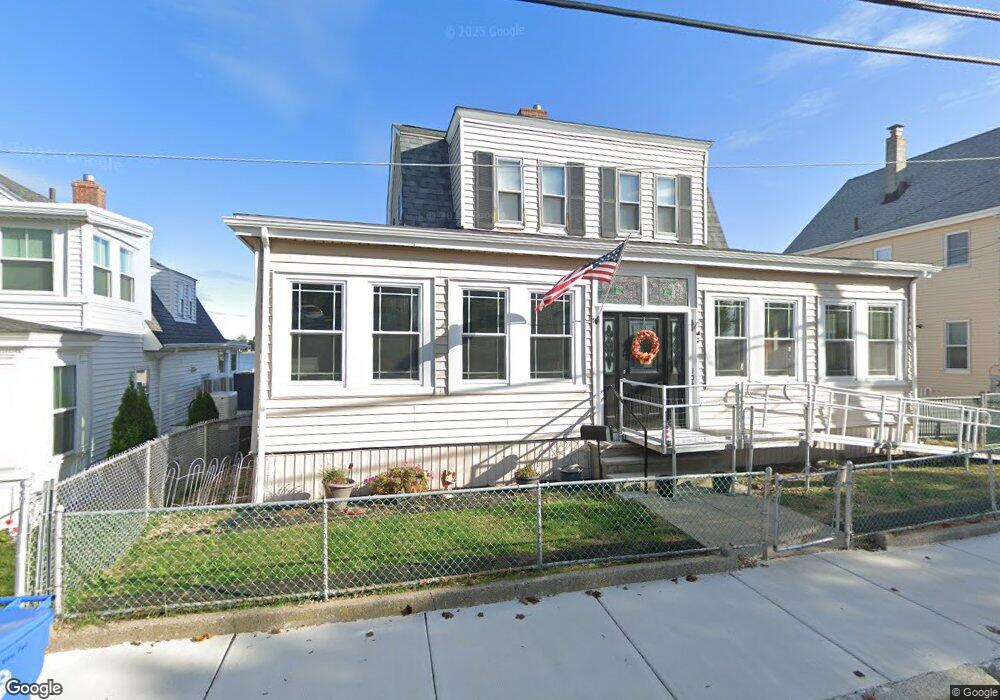
104 Bay View Ave Winthrop, MA 02152
Point Shirley NeighborhoodEstimated Value: $728,000 - $769,000
4
Beds
2
Baths
1,330
Sq Ft
$560/Sq Ft
Est. Value
About This Home
This home is located at 104 Bay View Ave, Winthrop, MA 02152 and is currently estimated at $745,463, approximately $560 per square foot. 104 Bay View Ave is a home located in Suffolk County with nearby schools including William P. Gorman/Fort Banks Elementary School, Arthur T. Cummings Elementary School, and Winthrop Middle School.
Ownership History
Date
Name
Owned For
Owner Type
Purchase Details
Closed on
Oct 18, 2024
Sold by
George W Bolster Sr Ft and Bolster
Bought by
Bolster Susan J
Current Estimated Value
Purchase Details
Closed on
Nov 16, 2015
Sold by
Bolster George W
Bought by
George W Bolster Sr Ft and Bolster
Purchase Details
Closed on
Jul 17, 2006
Sold by
Bolster George W and Bolster Marguerite A
Bought by
Bolster Rt and Bolster
Purchase Details
Closed on
Apr 14, 2006
Sold by
Bolster George W
Bought by
Bolster Rt and Bolster
Create a Home Valuation Report for This Property
The Home Valuation Report is an in-depth analysis detailing your home's value as well as a comparison with similar homes in the area
Home Values in the Area
Average Home Value in this Area
Purchase History
| Date | Buyer | Sale Price | Title Company |
|---|---|---|---|
| Bolster Susan J | -- | None Available | |
| Bolster Susan J | -- | None Available | |
| George W Bolster Sr Ft | -- | -- | |
| Bolster Rt | -- | -- | |
| Bolster Rt | -- | -- | |
| George W Bolster Sr Ft | -- | -- | |
| Bolster Rt | -- | -- | |
| Bolster Rt | -- | -- |
Source: Public Records
Mortgage History
| Date | Status | Borrower | Loan Amount |
|---|---|---|---|
| Previous Owner | Bolster Rt | $269,137 |
Source: Public Records
Tax History Compared to Growth
Tax History
| Year | Tax Paid | Tax Assessment Tax Assessment Total Assessment is a certain percentage of the fair market value that is determined by local assessors to be the total taxable value of land and additions on the property. | Land | Improvement |
|---|---|---|---|---|
| 2025 | $7,698 | $745,900 | $480,600 | $265,300 |
| 2024 | $7,743 | $743,100 | $462,000 | $281,100 |
| 2023 | $7,580 | $708,400 | $450,300 | $258,100 |
| 2022 | $7,362 | $626,000 | $401,900 | $224,100 |
| 2021 | $7,245 | $571,400 | $358,800 | $212,600 |
| 2020 | $7,211 | $571,400 | $358,800 | $212,600 |
| 2019 | $7,035 | $533,800 | $330,600 | $203,200 |
| 2018 | $6,388 | $451,100 | $257,300 | $193,800 |
| 2017 | $5,803 | $402,700 | $222,400 | $180,300 |
| 2016 | $5,681 | $369,600 | $193,400 | $176,200 |
| 2015 | $5,161 | $359,900 | $187,700 | $172,200 |
| 2014 | $5,193 | $333,300 | $174,600 | $158,700 |
Source: Public Records
Map
Nearby Homes
- 960 Shirley St
- 86 Undine Ave
- 1001 Shirley St Unit 1
- 1001 Shirley St Unit 3
- 900 Shirley St
- 86L Undine Ave
- 16 Pebble Ave
- 88 Grand View Ave
- 129 Strandway
- 41 Harbor View Ave
- 100 Cottage Ave
- 600 Shirley St Unit 3
- 600 Shirley St Unit 1
- 28 Thornton Park
- 92 Plummer Ave
- 51 Cutler St Unit 3
- 220 Woodside Ave Unit 1
- 28 Pearl Ave Unit 3
- 142 Pleasant St Unit 12
- 148 Winthrop Shore Dr Unit 5
- 102 Bay View Ave
- 100 Bay View Ave
- 108 Bay View Ave
- 957 Shirley St
- 957 Shirley St Unit Single Fam
- 961 Shirley St
- 98 Bay View Ave
- 953 Shirley St
- 953-2 Shirley St Unit 2
- 953-2 Shirley St
- 953 Shirley St
- 953 Shirley St Unit 2
- 953 Shirley St Unit 1
- 965 Shirley St
- 949 Shirley St
- 935 Shirley St
- 103 Bay View Ave
- 99 Bay View Ave
- 97 Bay View Ave
- 11 Hale Ave