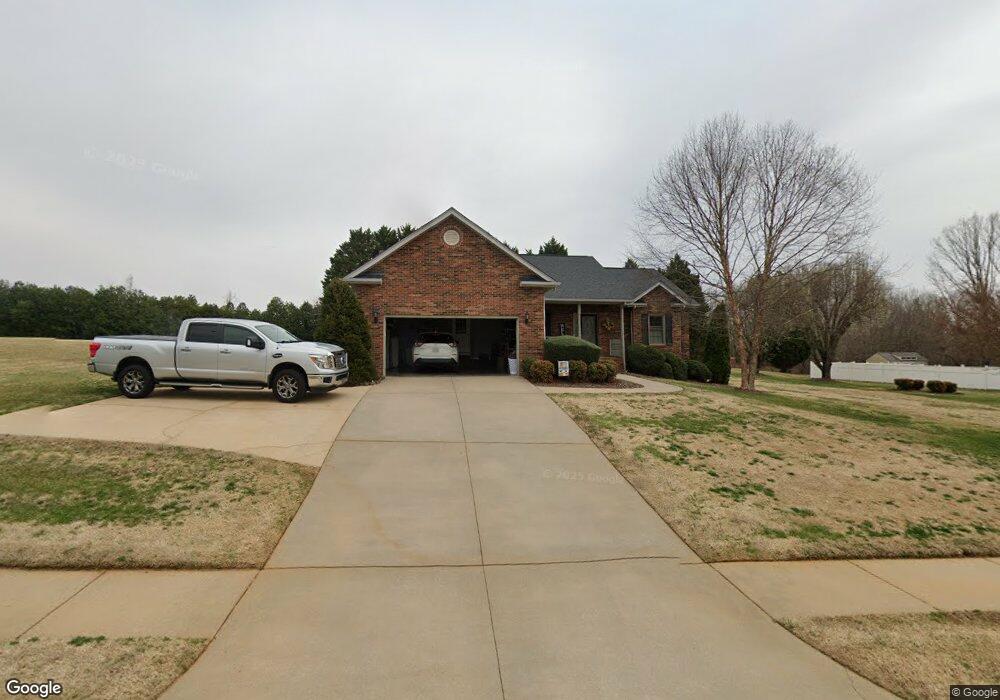
104 Benjamin Ct Shelby, NC 28152
Estimated Value: $357,000 - $531,000
--
Bed
--
Bath
1,867
Sq Ft
$220/Sq Ft
Est. Value
About This Home
This home is located at 104 Benjamin Ct, Shelby, NC 28152 and is currently estimated at $411,556, approximately $220 per square foot. 104 Benjamin Ct is a home located in Cleveland County with nearby schools including Boiling Springs Elementary School, Crest Middle School, and Crest High School.
Ownership History
Date
Name
Owned For
Owner Type
Purchase Details
Closed on
Mar 12, 2008
Sold by
Sisley Samuel James and Sisley Kim Elizabeth
Bought by
Brower James L and Brower Penny
Current Estimated Value
Home Financials for this Owner
Home Financials are based on the most recent Mortgage that was taken out on this home.
Original Mortgage
$100,000
Outstanding Balance
$62,098
Interest Rate
5.68%
Mortgage Type
Purchase Money Mortgage
Estimated Equity
$349,458
Purchase Details
Closed on
Jul 31, 2006
Sold by
Peters Mark and Peters Angela
Bought by
Sisley Samuel James and Sisley Kim Elizabeth
Home Financials for this Owner
Home Financials are based on the most recent Mortgage that was taken out on this home.
Original Mortgage
$64,000
Interest Rate
6.6%
Mortgage Type
New Conventional
Create a Home Valuation Report for This Property
The Home Valuation Report is an in-depth analysis detailing your home's value as well as a comparison with similar homes in the area
Home Values in the Area
Average Home Value in this Area
Purchase History
| Date | Buyer | Sale Price | Title Company |
|---|---|---|---|
| Brower James L | $210,000 | None Available | |
| Sisley Samuel James | $205,000 | None Available |
Source: Public Records
Mortgage History
| Date | Status | Borrower | Loan Amount |
|---|---|---|---|
| Open | Brower James L | $100,000 | |
| Previous Owner | Sisley Samuel James | $64,000 |
Source: Public Records
Tax History Compared to Growth
Tax History
| Year | Tax Paid | Tax Assessment Tax Assessment Total Assessment is a certain percentage of the fair market value that is determined by local assessors to be the total taxable value of land and additions on the property. | Land | Improvement |
|---|---|---|---|---|
| 2025 | $2,917 | $322,293 | $29,900 | $292,393 |
| 2024 | $2,427 | $216,891 | $26,163 | $190,728 |
| 2023 | $2,362 | $216,891 | $26,163 | $190,728 |
| 2022 | $2,350 | $216,891 | $26,163 | $190,728 |
| 2021 | $2,362 | $216,891 | $26,163 | $190,728 |
| 2020 | $2,067 | $180,984 | $25,228 | $155,756 |
| 2019 | $2,067 | $180,984 | $25,228 | $155,756 |
| 2018 | $2,012 | $180,984 | $25,228 | $155,756 |
| 2017 | $1,976 | $180,256 | $25,228 | $155,028 |
| 2016 | $1,911 | $180,256 | $25,228 | $155,028 |
| 2015 | $1,887 | $179,628 | $25,228 | $154,400 |
| 2014 | $1,887 | $179,628 | $25,228 | $154,400 |
Source: Public Records
Map
Nearby Homes
- 118 Southern Pine Dr
- 107 Southern Pines Dr
- TBD Patrick Ave
- 0 Patrick Ave Unit LotWP001
- 133 Brookview Dr
- 1622 Patrick Ave
- 1815 Gaffney Rd
- 415 Hillside St
- 301 Oak Ave
- 322 S Main St
- 1013 Point Crossing Ct Unit 25
- 245 E College Ave
- 231 Pineland Ave Unit 1
- 125 Woodhill Dr
- 116 Fairview St
- 237 Edgewood St
- 00 N Main St
- 129 Creekside Dr
- 0 W College Ave
- 300 Hidden Creek Dr
- 106 Benjamin Ct
- 102 Benjamin Ct
- 105 Benjamin Ct
- 102 Tall Pine Dr
- 108 Benjamin Ct
- 100 Benjamin Ct
- 103 Benjamin Ct
- 103 Tall Pine Dr
- 101 Benjamin Ct
- 110 Benjamin Ct
- 108 Southern Pines Dr
- 101 Tall Pine Dr
- 103 Blue Spruce Dr
- 105 Blue Spruce Dr
- 111 Benjamin Ct
- 106 Southern Pines Dr
- 114 Southern Pines Dr
- 107 Blue Spruce Dr
- 112 Benjamin Ct
- 107 Southern Pine Dr