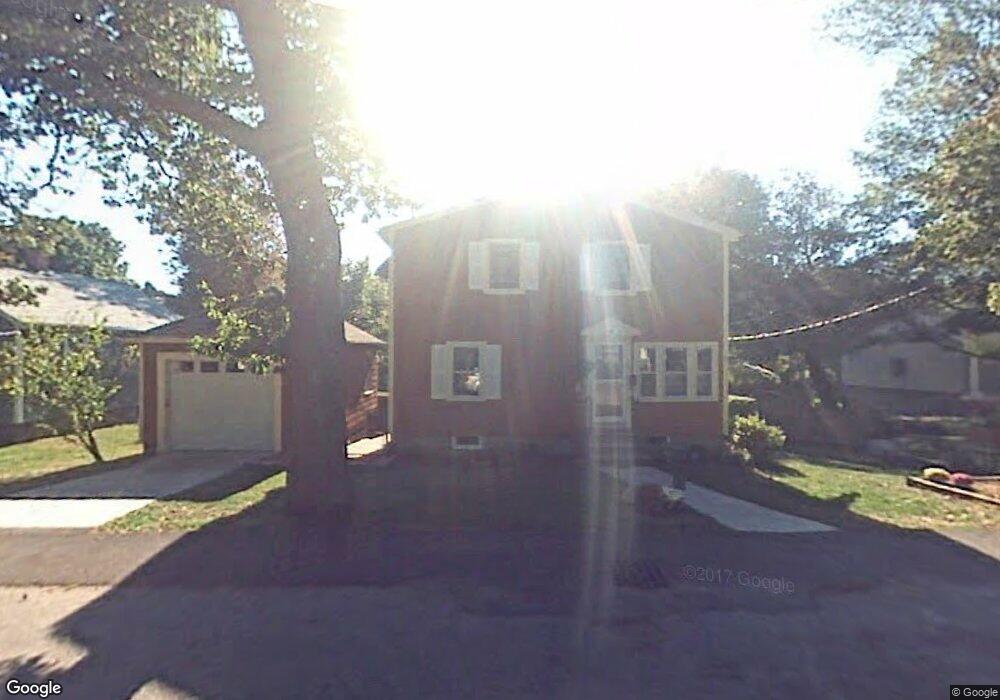
104 Bow St Peabody, MA 01960
West Peabody NeighborhoodEstimated Value: $710,213 - $749,000
3
Beds
2
Baths
1,704
Sq Ft
$427/Sq Ft
Est. Value
About This Home
This home is located at 104 Bow St, Peabody, MA 01960 and is currently estimated at $728,303, approximately $427 per square foot. 104 Bow St is a home located in Essex County with nearby schools including Peabody Veterans Memorial High School and Covenant Christian Academy.
Ownership History
Date
Name
Owned For
Owner Type
Purchase Details
Closed on
Apr 17, 2015
Sold by
Leblanc Francis J and Leblanc Christine D
Bought by
Leblanc Ft and Leblanc Francis J
Current Estimated Value
Purchase Details
Closed on
Dec 28, 1990
Sold by
Lavoie Joseph A
Bought by
Leblanc Francis J
Create a Home Valuation Report for This Property
The Home Valuation Report is an in-depth analysis detailing your home's value as well as a comparison with similar homes in the area
Home Values in the Area
Average Home Value in this Area
Purchase History
| Date | Buyer | Sale Price | Title Company |
|---|---|---|---|
| Leblanc Ft | -- | -- | |
| Leblanc Francis J | $160,000 | -- |
Source: Public Records
Mortgage History
| Date | Status | Borrower | Loan Amount |
|---|---|---|---|
| Previous Owner | Leblanc Francis J | $200,000 | |
| Previous Owner | Leblanc Francis J | $26,000 |
Source: Public Records
Tax History Compared to Growth
Tax History
| Year | Tax Paid | Tax Assessment Tax Assessment Total Assessment is a certain percentage of the fair market value that is determined by local assessors to be the total taxable value of land and additions on the property. | Land | Improvement |
|---|---|---|---|---|
| 2025 | $5,099 | $550,600 | $269,200 | $281,400 |
| 2024 | $5,357 | $587,400 | $269,200 | $318,200 |
| 2023 | $4,727 | $496,500 | $224,300 | $272,200 |
| 2022 | $4,439 | $439,500 | $195,100 | $244,400 |
| 2021 | $4,244 | $404,600 | $177,400 | $227,200 |
| 2020 | $4,188 | $389,900 | $177,400 | $212,500 |
| 2019 | $3,854 | $350,000 | $177,400 | $172,600 |
| 2018 | $3,996 | $348,700 | $158,400 | $190,300 |
| 2017 | $3,713 | $315,700 | $158,400 | $157,300 |
| 2016 | $3,789 | $317,900 | $158,400 | $159,500 |
| 2015 | -- | $285,900 | $158,400 | $127,500 |
Source: Public Records
Map
Nearby Homes