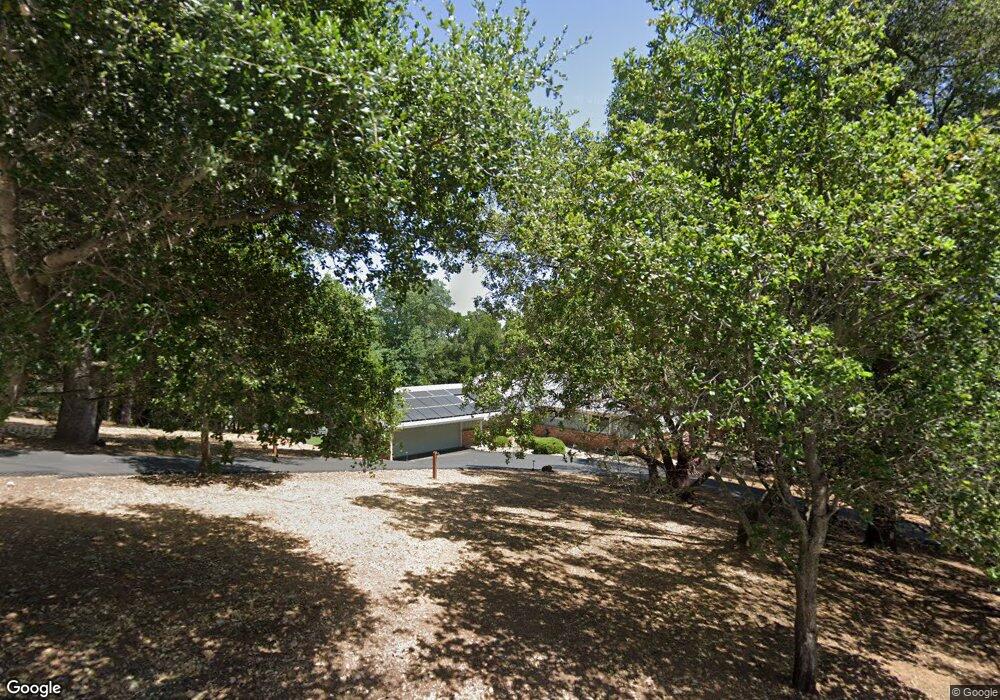
104 Brae Ct Fairfield, CA 94534
Estimated Value: $1,025,000 - $1,623,000
3
Beds
3
Baths
2,479
Sq Ft
$486/Sq Ft
Est. Value
About This Home
This home is located at 104 Brae Ct, Fairfield, CA 94534 and is currently estimated at $1,204,430, approximately $485 per square foot. 104 Brae Ct is a home located in Solano County with nearby schools including Nelda Mundy Elementary School, Green Valley Middle School, and Angelo Rodriguez High School.
Ownership History
Date
Name
Owned For
Owner Type
Purchase Details
Closed on
Sep 24, 2012
Sold by
Wilson Shari Ann and Wilson Bruce Edward
Bought by
Wilson Bruce Edward and Wilson Shari Ann
Current Estimated Value
Purchase Details
Closed on
Aug 20, 2010
Sold by
Wilson Bruce Edward and Wilson Shari Ann
Bought by
Wilson Bruce Edward and Wilson Shari Ann
Purchase Details
Closed on
May 11, 2010
Sold by
Carter Richard W
Bought by
Wilson Bruce Edward and Wilson Shari Ann
Home Financials for this Owner
Home Financials are based on the most recent Mortgage that was taken out on this home.
Original Mortgage
$400,000
Outstanding Balance
$270,196
Interest Rate
5.21%
Mortgage Type
New Conventional
Estimated Equity
$934,234
Purchase Details
Closed on
Aug 29, 2002
Sold by
Carter Richard W
Bought by
Carter Richard W
Purchase Details
Closed on
May 14, 1997
Sold by
Carter Richard W and Carter Willette
Bought by
Carter Richard W and Carter Willette H
Create a Home Valuation Report for This Property
The Home Valuation Report is an in-depth analysis detailing your home's value as well as a comparison with similar homes in the area
Home Values in the Area
Average Home Value in this Area
Purchase History
| Date | Buyer | Sale Price | Title Company |
|---|---|---|---|
| Wilson Bruce Edward | -- | Orange Coast Title | |
| Wilson Shari Ann | -- | Orange Coast Title | |
| Wilson Bruce Edward | -- | None Available | |
| Wilson Bruce Edward | $500,000 | First American Title Company | |
| Carter Richard W | -- | -- | |
| Carter Richard W | -- | -- |
Source: Public Records
Mortgage History
| Date | Status | Borrower | Loan Amount |
|---|---|---|---|
| Open | Wilson Bruce Edward | $400,000 |
Source: Public Records
Tax History Compared to Growth
Tax History
| Year | Tax Paid | Tax Assessment Tax Assessment Total Assessment is a certain percentage of the fair market value that is determined by local assessors to be the total taxable value of land and additions on the property. | Land | Improvement |
|---|---|---|---|---|
| 2025 | $7,623 | $645,402 | $161,346 | $484,056 |
| 2024 | $7,623 | $632,748 | $158,183 | $474,565 |
| 2023 | $7,400 | $620,342 | $155,082 | $465,260 |
| 2022 | $7,305 | $608,180 | $152,043 | $456,137 |
| 2021 | $7,227 | $596,256 | $149,062 | $447,194 |
| 2020 | $7,058 | $590,143 | $147,534 | $442,609 |
| 2019 | $6,881 | $578,573 | $144,642 | $433,931 |
| 2018 | $7,070 | $567,229 | $141,806 | $425,423 |
| 2017 | $6,753 | $556,108 | $139,026 | $417,082 |
| 2016 | $6,703 | $545,204 | $136,300 | $408,904 |
| 2015 | $6,275 | $537,015 | $134,253 | $402,762 |
| 2014 | $6,211 | $526,497 | $131,624 | $394,873 |
Source: Public Records
Map
Nearby Homes
- 103 Brae Ct
- 4320 Edinburg Ct
- 1687 Rockville Rd
- 1424 Rockville Rd
- 4499 Green Valley Rd
- 4418 Green Valley Rd
- 0 Vac Sn Luis Potosi Vic Eljorna Unit HD25051665
- 1795 Green Valley Oaks Dr
- 1879 Rockville Rd
- 0 Green Valley Ln Unit Lot 5 325038523
- 0 Green Valley Ln Unit Lot 6 325038375
- 0 Green Valley Ln Unit Lot 3 325038524
- 4144 Green Valley Rd
- 1009 Cypressridge Place
- 955 Appleridge Place
- 2129 Rockville Rd
- 743 Bridle Ridge Ct
- 746 Bridle Ridge Ct
- 5249 Deer Ridge Ct
- 738 Bridle Ridge Ct