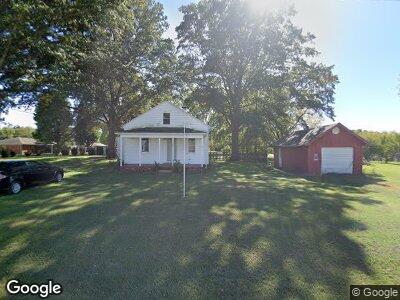
104 Branch St Ellis Grove, IL 62241
Estimated Value: $46,553 - $81,000
--
Bed
--
Bath
--
Sq Ft
0.8
Acres
About This Home
This home is located at 104 Branch St, Ellis Grove, IL 62241 and is currently estimated at $59,388. 104 Branch St is a home located in Randolph County with nearby schools including Chester Elementary School and Chester High School.
Ownership History
Date
Name
Owned For
Owner Type
Purchase Details
Closed on
Aug 27, 2021
Sold by
Brown Jason D and Brown Angela M
Bought by
Thornton Kateland M
Current Estimated Value
Home Financials for this Owner
Home Financials are based on the most recent Mortgage that was taken out on this home.
Original Mortgage
$19,000
Outstanding Balance
$18,055
Interest Rate
5.75%
Mortgage Type
New Conventional
Estimated Equity
$40,877
Purchase Details
Closed on
Apr 5, 2021
Sold by
Poole Gregory and Poole Tina
Bought by
Brown Jason D and Brown Angela M
Purchase Details
Closed on
Jun 7, 2018
Sold by
Courier Kenneth W and Courier Patricia K
Bought by
Poole Gregory and Poole Tina
Create a Home Valuation Report for This Property
The Home Valuation Report is an in-depth analysis detailing your home's value as well as a comparison with similar homes in the area
Home Values in the Area
Average Home Value in this Area
Purchase History
| Date | Buyer | Sale Price | Title Company |
|---|---|---|---|
| Thornton Kateland M | $22,000 | None Available | |
| Brown Jason D | $16,000 | None Available | |
| Poole Gregory | $30,000 | None Available |
Source: Public Records
Mortgage History
| Date | Status | Borrower | Loan Amount |
|---|---|---|---|
| Open | Thornton Kateland M | $19,000 |
Source: Public Records
Tax History Compared to Growth
Tax History
| Year | Tax Paid | Tax Assessment Tax Assessment Total Assessment is a certain percentage of the fair market value that is determined by local assessors to be the total taxable value of land and additions on the property. | Land | Improvement |
|---|---|---|---|---|
| 2023 | $397 | $12,690 | $4,880 | $7,810 |
| 2022 | $920 | $21,345 | $4,600 | $16,745 |
| 2021 | $1,235 | $20,835 | $4,490 | $16,345 |
| 2020 | $1,266 | $21,277 | $2,986 | $18,291 |
| 2019 | $1,231 | $19,040 | $2,670 | $16,370 |
| 2018 | $1,151 | $20,992 | $2,944 | $18,048 |
| 2017 | $1,132 | $18,855 | $2,645 | $16,210 |
| 2016 | $1,205 | $18,610 | $2,610 | $16,000 |
| 2015 | $1,178 | $18,245 | $2,560 | $15,685 |
| 2014 | $1,178 | $18,245 | $2,560 | $15,685 |
| 2013 | $1,113 | $18,245 | $2,560 | $15,685 |
Source: Public Records
Map
Nearby Homes