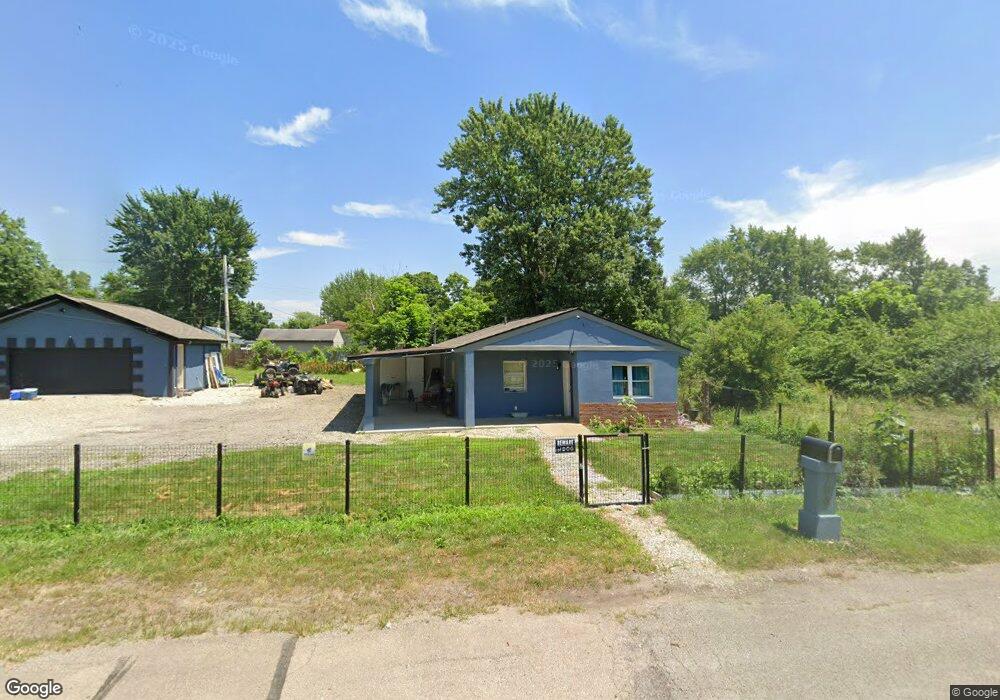
104 Bricker Ave Dayton, OH 45417
Estimated Value: $50,692 - $68,000
2
Beds
1
Bath
888
Sq Ft
$69/Sq Ft
Est. Value
About This Home
This home is located at 104 Bricker Ave, Dayton, OH 45417 and is currently estimated at $60,923, approximately $68 per square foot. 104 Bricker Ave is a home located in Montgomery County with nearby schools including Blairwood Elementary School and Jefferson High School.
Ownership History
Date
Name
Owned For
Owner Type
Purchase Details
Closed on
Mar 1, 2021
Sold by
Mendenhall Donald E
Bought by
Menjivor Norma Yoneth Avelor
Current Estimated Value
Purchase Details
Closed on
Jan 28, 2020
Sold by
Mendenhall Jared L and Mendenhall Karley Schyl
Bought by
Mendenhall Donald E
Purchase Details
Closed on
Dec 12, 2019
Sold by
Cook Derrick L
Bought by
Mendenhall Jared L
Purchase Details
Closed on
Nov 2, 2018
Sold by
Dela Cruz Beliza
Bought by
Cook Derrick L
Purchase Details
Closed on
Jun 17, 2011
Sold by
Cook Yvette
Bought by
Dela Cruz Beliza
Purchase Details
Closed on
Dec 20, 2010
Sold by
Dela Cruz Beliza
Bought by
Cook Yvette
Purchase Details
Closed on
Mar 9, 2007
Sold by
Hancock Charles
Bought by
Dela Cruz Beliza
Purchase Details
Closed on
Dec 12, 2002
Sold by
Black Shelby
Bought by
Hancock Jocelyn T and Hancock Charles
Purchase Details
Closed on
Mar 8, 1999
Sold by
Black William Harold and Coffee Joyce
Bought by
Black Shelby
Create a Home Valuation Report for This Property
The Home Valuation Report is an in-depth analysis detailing your home's value as well as a comparison with similar homes in the area
Purchase History
| Date | Buyer | Sale Price | Title Company |
|---|---|---|---|
| Menjivor Norma Yoneth Avelor | $9,000 | None Available | |
| Mendenhall Donald E | -- | None Available | |
| Mendenhall Jared L | $1,000 | None Available | |
| Cook Derrick L | -- | None Available | |
| Dela Cruz Beliza | $13,000 | None Available | |
| Cook Yvette | -- | None Available | |
| Dela Cruz Beliza | $13,000 | None Available | |
| Hancock Jocelyn T | $12,000 | -- | |
| Black Shelby | -- | -- |
Source: Public Records
Tax History
| Year | Tax Paid | Tax Assessment Tax Assessment Total Assessment is a certain percentage of the fair market value that is determined by local assessors to be the total taxable value of land and additions on the property. | Land | Improvement |
|---|---|---|---|---|
| 2025 | $612 | $8,330 | $1,660 | $6,670 |
| 2024 | $597 | $8,330 | $1,660 | $6,670 |
| 2023 | $597 | $8,330 | $1,660 | $6,670 |
| 2022 | $580 | $6,710 | $1,660 | $5,050 |
| 2021 | $75 | $6,710 | $1,660 | $5,050 |
| 2020 | $832 | $6,710 | $1,660 | $5,050 |
| 2019 | $1,116 | $5,090 | $1,260 | $3,830 |
| 2018 | $775 | $5,090 | $1,260 | $3,830 |
| 2017 | $626 | $5,090 | $1,260 | $3,830 |
| 2016 | $609 | $4,980 | $1,260 | $3,720 |
| 2015 | $558 | $4,980 | $1,260 | $3,720 |
| 2014 | $558 | $4,980 | $1,260 | $3,720 |
| 2012 | -- | $4,310 | $1,070 | $3,240 |
Source: Public Records
Map
Nearby Homes
- 180 S Union Rd
- 6290 Forestdale Ave
- 0 Infirmary Rd Unit 953331
- 764 Miller Ave
- 12 Jenkins Dr
- 154 Pomeroy Ave
- 144 Pomeroy Ave
- 6925 W Third St
- 137 Bluecrest Ave
- 5216 W Third St
- 72 Patton Ave
- 5230 Hoover Ave
- 5354 Gardendale Ave
- 5147 Whaley Dr
- 2250 Infirmary Rd
- 1107 Rossiter Dr
- 418 Mia Ave
- 786 Goodlow Ave
- 5037 Retford Dr
- 734 Tyson Ave
- 105 Maeder Ave
- 101 Maeder Ave
- 122 Bricker Ave
- 113 Maeder Ave
- 26 Bricker Ave
- 105 Bricker Ave
- 101 Bricker Ave
- 113 Bricker Ave
- 29 Maeder Ave
- 121 Maeder Ave
- 22 Bricker Ave
- 25 Maeder Ave
- 126 Bricker Ave
- 21 Maeder Ave
- 129 Maeder Ave
- 127 Bricker Ave
- 21 Bricker Ave
- 104 Maeder Ave
- 129 Bricker Ave
- 100 Maeder Ave
Your Personal Tour Guide
Ask me questions while you tour the home.