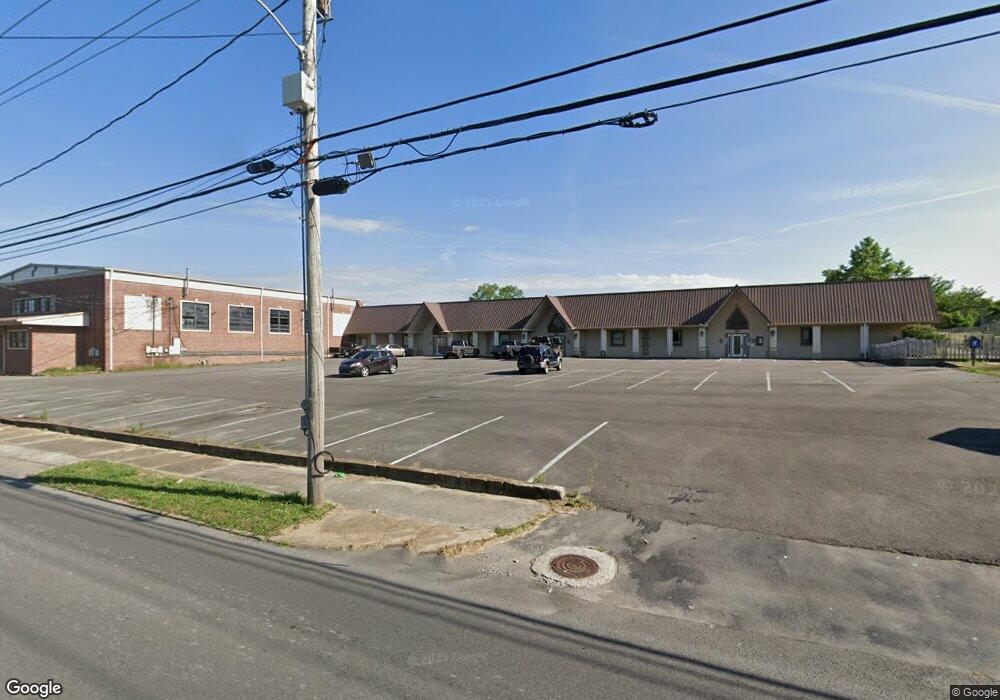
104 Colloredo Blvd Shelbyville, TN 37160
Estimated Value: $268,651
--
Bed
--
Bath
8,190
Sq Ft
$33/Sq Ft
Est. Value
About This Home
This home is located at 104 Colloredo Blvd, Shelbyville, TN 37160 and is currently estimated at $268,651, approximately $32 per square foot. 104 Colloredo Blvd is a home located in Bedford County with nearby schools including Eakin Elementary School, Harris Middle School, and Christian Chapel Academy.
Ownership History
Date
Name
Owned For
Owner Type
Purchase Details
Closed on
Sep 14, 2020
Sold by
Onafowokan Obafemi S
Bought by
Bagwell Kenneth and Thrash Gary
Current Estimated Value
Purchase Details
Closed on
Jan 31, 2019
Sold by
Bagwell Kenneth and Bagwell Pamela
Bought by
Onafowokan Obafemi S
Home Financials for this Owner
Home Financials are based on the most recent Mortgage that was taken out on this home.
Original Mortgage
$125,000
Interest Rate
4.6%
Mortgage Type
Seller Take Back
Purchase Details
Closed on
Jul 14, 2006
Bought by
Bagwell Kenneth and Bagwell Pamela
Purchase Details
Closed on
Feb 11, 1986
Bought by
Richardson Enterprises Incorporated
Purchase Details
Closed on
Jul 26, 1983
Bought by
Richardson Enterprises Incorporated
Create a Home Valuation Report for This Property
The Home Valuation Report is an in-depth analysis detailing your home's value as well as a comparison with similar homes in the area
Home Values in the Area
Average Home Value in this Area
Purchase History
| Date | Buyer | Sale Price | Title Company |
|---|---|---|---|
| Bagwell Kenneth | $125,000 | None Available | |
| Onafowokan Obafemi S | $145,000 | Hitchcock Title Company | |
| Bagwell Kenneth | $150,000 | -- | |
| Richardson Enterprises Incorporated | -- | -- | |
| Richardson Enterprises Incorporated | -- | -- |
Source: Public Records
Mortgage History
| Date | Status | Borrower | Loan Amount |
|---|---|---|---|
| Previous Owner | Onafowokan Obafemi S | $125,000 |
Source: Public Records
Tax History Compared to Growth
Tax History
| Year | Tax Paid | Tax Assessment Tax Assessment Total Assessment is a certain percentage of the fair market value that is determined by local assessors to be the total taxable value of land and additions on the property. | Land | Improvement |
|---|---|---|---|---|
| 2025 | -- | $75,800 | $0 | $0 |
| 2024 | -- | $75,800 | $57,800 | $18,000 |
| 2023 | $1,122 | $75,800 | $57,800 | $18,000 |
| 2022 | $2,968 | $75,800 | $57,800 | $18,000 |
| 2021 | $1,490 | $75,800 | $57,800 | $18,000 |
| 2020 | $3,246 | $75,800 | $57,800 | $18,000 |
| 2019 | $3,246 | $73,280 | $55,000 | $18,280 |
| 2018 | $3,173 | $73,280 | $55,000 | $18,280 |
| 2017 | $3,173 | $73,280 | $55,000 | $18,280 |
| 2016 | $3,144 | $73,280 | $55,000 | $18,280 |
| 2015 | $3,144 | $73,280 | $55,000 | $18,280 |
| 2014 | $2,595 | $66,190 | $0 | $0 |
Source: Public Records
Map
Nearby Homes
- 1000 Woodbury St
- 130 Horseshoe Dr
- 0 Hilltop Rd Unit RTC2897754
- 0 Hilltop Rd Unit RTC3001632
- 329 Dover St
- 152 Demonbreum Cir
- 110 Demonbreum Cir
- 112 E Cedar St
- 106 Demonbreum Cir
- 107 Demonbreum Cir
- 111 Demonbreum Cir
- 100 Demombreum Cir
- 112 Demombreum Cir
- 109 Demombreum Cir
- 115 W End Cir
- 108 Demombreum Cir
- 703 Deery St
- 527 Deery St
- 312 Cottonwood Dr
- 636 Deery St