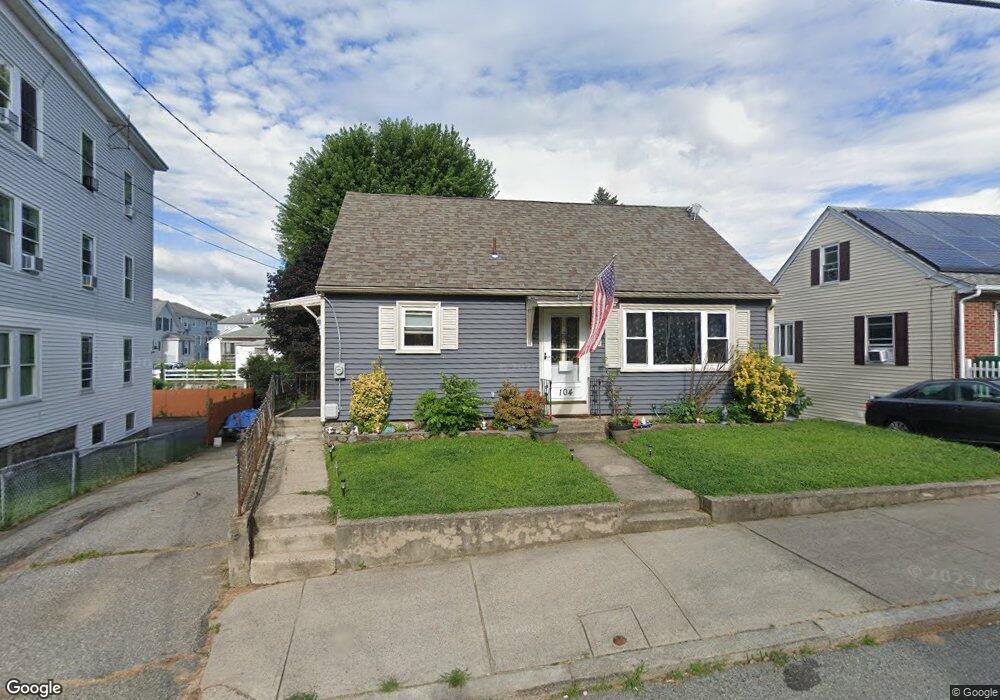
104 Cote Ave Woonsocket, RI 02895
East Woonsocket NeighborhoodEstimated Value: $366,000 - $382,000
3
Beds
1
Bath
1,250
Sq Ft
$299/Sq Ft
Est. Value
About This Home
This home is located at 104 Cote Ave, Woonsocket, RI 02895 and is currently estimated at $374,123, approximately $299 per square foot. 104 Cote Ave is a home located in Providence County with nearby schools including Woonsocket High School and Good Shepherd Catholic School.
Ownership History
Date
Name
Owned For
Owner Type
Purchase Details
Closed on
Mar 14, 1997
Sold by
Brousseau Phillippe H and Brousseau Richard H
Bought by
Niquette Wilfred R
Current Estimated Value
Home Financials for this Owner
Home Financials are based on the most recent Mortgage that was taken out on this home.
Original Mortgage
$72,182
Interest Rate
7.79%
Mortgage Type
Purchase Money Mortgage
Create a Home Valuation Report for This Property
The Home Valuation Report is an in-depth analysis detailing your home's value as well as a comparison with similar homes in the area
Home Values in the Area
Average Home Value in this Area
Purchase History
| Date | Buyer | Sale Price | Title Company |
|---|---|---|---|
| Niquette Wilfred R | $72,500 | -- | |
| Niquette Wilfred R | $72,500 | -- |
Source: Public Records
Mortgage History
| Date | Status | Borrower | Loan Amount |
|---|---|---|---|
| Open | Niquette Wilfred R | $161,000 | |
| Closed | Niquette Wilfred R | $200,203 | |
| Closed | Niquette Wilfred R | $103,000 | |
| Closed | Niquette Wilfred R | $72,182 |
Source: Public Records
Tax History Compared to Growth
Tax History
| Year | Tax Paid | Tax Assessment Tax Assessment Total Assessment is a certain percentage of the fair market value that is determined by local assessors to be the total taxable value of land and additions on the property. | Land | Improvement |
|---|---|---|---|---|
| 2025 | $3,578 | $318,600 | $89,200 | $229,400 |
| 2024 | $3,530 | $242,800 | $90,800 | $152,000 |
| 2023 | $3,394 | $242,800 | $90,800 | $152,000 |
| 2022 | $3,394 | $242,800 | $90,800 | $152,000 |
| 2021 | $3,323 | $139,900 | $36,900 | $103,000 |
| 2020 | $3,358 | $139,900 | $36,900 | $103,000 |
| 2018 | $3,369 | $139,900 | $36,900 | $103,000 |
| 2017 | $3,534 | $117,400 | $40,500 | $76,900 |
| 2016 | $3,738 | $117,400 | $40,500 | $76,900 |
| 2015 | $4,294 | $117,400 | $40,500 | $76,900 |
| 2014 | $3,054 | $121,400 | $44,600 | $76,800 |
Source: Public Records
Map
Nearby Homes
- 23 Rutland St
- 112 Le Brun Ave
- 546 Robinson St
- 203 Dulude Ave
- 208 Dulude Ave
- 56 Mailloux St
- 311 Elm St
- 110 Saint Leon Ave
- 142 Brook St
- 685 Social St Unit 211
- 685 Social St Unit 115
- 96 E Mill St
- 65 Mill St
- 752 Social St
- 237 Congress St
- 95 Mitris Blvd
- 555 Diamond Hill Rd Unit 204
- 188 Saint Louis Ave
- 96 Mill St Unit 303
- 84 Chester St