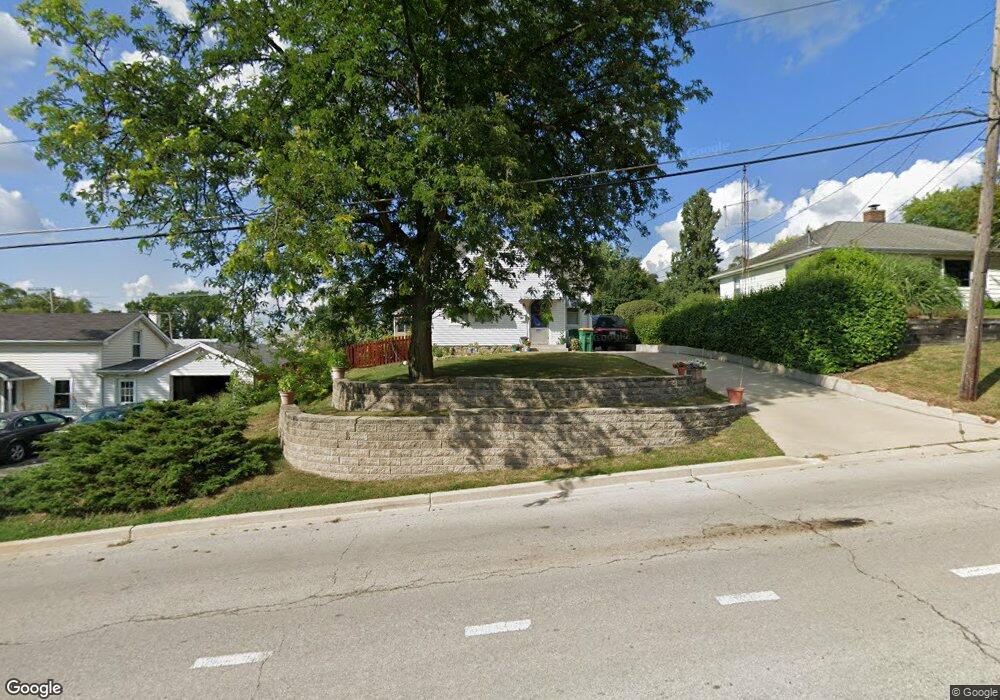
104 E 2nd St Lockport, IL 60441
Estimated Value: $257,893 - $315,000
Studio
1
Bath
1,155
Sq Ft
$245/Sq Ft
Est. Value
About This Home
This home is located at 104 E 2nd St, Lockport, IL 60441 and is currently estimated at $283,473, approximately $245 per square foot. 104 E 2nd St is a home located in Will County with nearby schools including Milne Grove Elementary School, Kelvin Grove Jr High School, and Lockport Township High School East.
Ownership History
Date
Name
Owned For
Owner Type
Purchase Details
Closed on
Jun 2, 2005
Sold by
Coddington Tammy L
Bought by
Rizo Michael J
Current Estimated Value
Home Financials for this Owner
Home Financials are based on the most recent Mortgage that was taken out on this home.
Original Mortgage
$147,175
Outstanding Balance
$77,131
Interest Rate
5.82%
Mortgage Type
FHA
Estimated Equity
$206,342
Purchase Details
Closed on
Sep 8, 2003
Sold by
Woodworth Adam and Woodworth Krista
Bought by
Coddington Tammy L
Home Financials for this Owner
Home Financials are based on the most recent Mortgage that was taken out on this home.
Original Mortgage
$128,725
Interest Rate
5%
Mortgage Type
Purchase Money Mortgage
Purchase Details
Closed on
Nov 21, 1996
Sold by
Holm Delbert L and Holm Stella A
Bought by
Woodworth Adam and Woodworth Krista
Home Financials for this Owner
Home Financials are based on the most recent Mortgage that was taken out on this home.
Original Mortgage
$106,902
Interest Rate
7.91%
Mortgage Type
FHA
Create a Home Valuation Report for This Property
The Home Valuation Report is an in-depth analysis detailing your home's value as well as a comparison with similar homes in the area
Home Values in the Area
Average Home Value in this Area
Purchase History
| Date | Buyer | Sale Price | Title Company |
|---|---|---|---|
| Rizo Michael J | $155,000 | Chicago Title Insurance Comp | |
| Coddington Tammy L | $135,500 | Ticor Title | |
| Woodworth Adam | $108,000 | -- |
Source: Public Records
Mortgage History
| Date | Status | Borrower | Loan Amount |
|---|---|---|---|
| Open | Rizo Michael J | $147,175 | |
| Previous Owner | Coddington Tammy L | $128,725 | |
| Previous Owner | Woodworth Adam | $106,902 |
Source: Public Records
Tax History
| Year | Tax Paid | Tax Assessment Tax Assessment Total Assessment is a certain percentage of the fair market value that is determined by local assessors to be the total taxable value of land and additions on the property. | Land | Improvement |
|---|---|---|---|---|
| 2024 | $6,044 | $78,402 | $20,958 | $57,444 |
| 2023 | $6,044 | $70,385 | $18,815 | $51,570 |
| 2022 | $5,326 | $63,849 | $17,550 | $46,299 |
| 2021 | $5,033 | $60,003 | $16,493 | $43,510 |
| 2020 | $4,898 | $58,030 | $15,951 | $42,079 |
| 2019 | $4,641 | $55,004 | $15,119 | $39,885 |
| 2018 | $4,351 | $50,848 | $13,976 | $36,872 |
| 2017 | $3,991 | $46,156 | $12,687 | $33,469 |
| 2016 | $3,729 | $42,577 | $11,703 | $30,874 |
| 2015 | $3,295 | $37,537 | $10,407 | $27,130 |
| 2014 | $3,295 | $36,094 | $10,007 | $26,087 |
| 2013 | $3,295 | $36,830 | $10,211 | $26,619 |
Source: Public Records
Map
Nearby Homes
- 120 N State St
- 118 N State St
- 134 S Jefferson St
- 501 S Hamilton St
- 500 Clinton St
- 519 S Washington St
- 502 W 7th St
- 1016 S State St
- 1330 Lacoma Ct
- 310 Mccameron Ave
- 936 Treeline Ct Unit 5B
- 1120 S Hamilton St
- 1015 Grandview Ave
- 1200 S State St
- 805 Maryknoll Dr
- 1041 Ashley Ct S Unit 2D
- 202 E 14th St
- 1513 Connor Ave
- 1.4 Acres S Archer Ave
- 1600 Fairmount
- 118 E 2nd St
- 102 E 2nd St
- 100 N State St
- 103 S Hamilton St
- 128 E 2nd St
- 105 E 2nd St
- 101 S Hamilton St
- 107 E 2nd St
- 202 S State St
- 102 N State St
- 203 S Hamilton St
- 210 S State St
- 108 N State St
- 217 S Hamilton St
- 107 S State St
- 219 S Hamilton St
- 106 Thornton St
- 116 N State St
- 204 E 2nd St
- 218 S State St