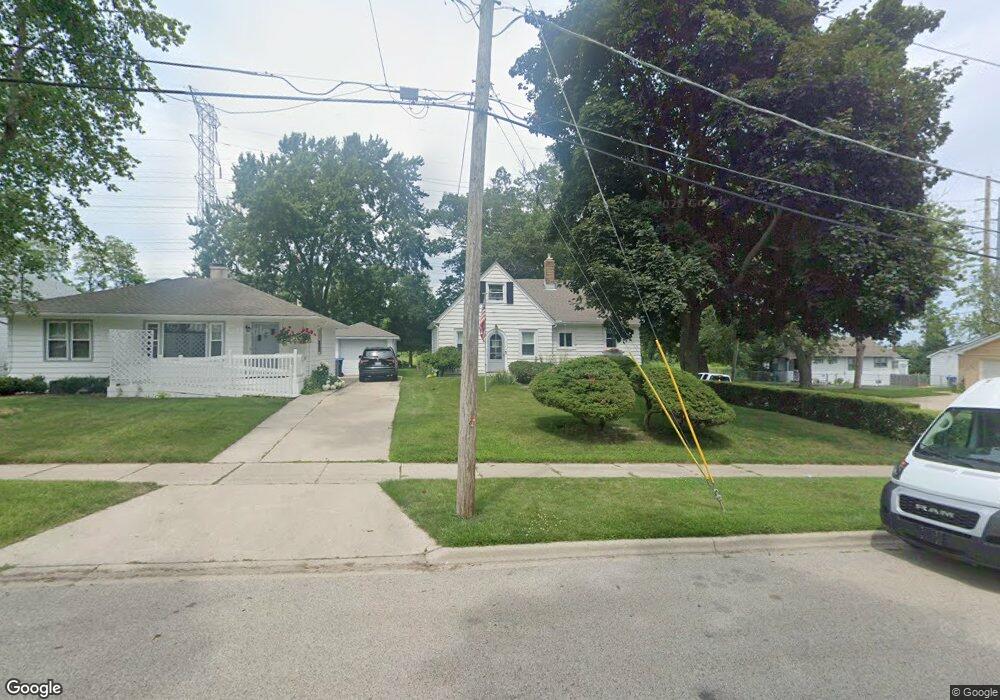
104 E Keith Ave Waukegan, IL 60085
Estimated Value: $220,566 - $225,000
4
Beds
1
Bath
905
Sq Ft
$246/Sq Ft
Est. Value
About This Home
This home is located at 104 E Keith Ave, Waukegan, IL 60085 and is currently estimated at $222,392, approximately $245 per square foot. 104 E Keith Ave is a home located in Lake County with nearby schools including Greenwood Elementary School, Edith M Smith Middle School, and Waukegan High School.
Ownership History
Date
Name
Owned For
Owner Type
Purchase Details
Closed on
Mar 27, 2010
Sold by
Dinicola John C
Bought by
Dinicola John C and Dinicola Donna Martin
Current Estimated Value
Home Financials for this Owner
Home Financials are based on the most recent Mortgage that was taken out on this home.
Original Mortgage
$79,064
Outstanding Balance
$38,421
Interest Rate
3.5%
Mortgage Type
VA
Estimated Equity
$183,971
Purchase Details
Closed on
Oct 11, 2000
Sold by
Hollstein Harold M and Fern Hollstein Trust
Bought by
Dinicola John C
Home Financials for this Owner
Home Financials are based on the most recent Mortgage that was taken out on this home.
Original Mortgage
$118,965
Interest Rate
7.9%
Mortgage Type
VA
Purchase Details
Closed on
Jan 31, 1996
Sold by
Hollstein Fern and Fern Hollstein Trust
Bought by
Hollstein Fern and Fern Hollstein Trust
Purchase Details
Closed on
Dec 8, 1995
Sold by
Hollstein Fern
Bought by
Fern Hollstein Trust
Create a Home Valuation Report for This Property
The Home Valuation Report is an in-depth analysis detailing your home's value as well as a comparison with similar homes in the area
Purchase History
| Date | Buyer | Sale Price | Title Company |
|---|---|---|---|
| Dinicola John C | -- | National Title Network | |
| Dinicola John C | $115,500 | Collar Counties Title Plant | |
| Hollstein Fern | -- | -- | |
| Fern Hollstein Trust | -- | -- |
Source: Public Records
Mortgage History
| Date | Status | Borrower | Loan Amount |
|---|---|---|---|
| Open | Dinicola John C | $79,064 | |
| Closed | Dinicola John C | $118,965 |
Source: Public Records
Tax History
| Year | Tax Paid | Tax Assessment Tax Assessment Total Assessment is a certain percentage of the fair market value that is determined by local assessors to be the total taxable value of land and additions on the property. | Land | Improvement |
|---|---|---|---|---|
| 2024 | $3,883 | $55,432 | $10,550 | $44,882 |
| 2023 | $3,683 | $49,181 | $9,360 | $39,821 |
| 2022 | $3,683 | $43,674 | $7,321 | $36,353 |
| 2021 | $3,165 | $36,356 | $6,297 | $30,059 |
| 2020 | $3,159 | $33,870 | $5,866 | $28,004 |
| 2019 | $3,127 | $31,036 | $5,375 | $25,661 |
| 2018 | $2,803 | $28,059 | $7,608 | $20,451 |
| 2017 | $2,678 | $24,824 | $6,731 | $18,093 |
| 2016 | $2,406 | $21,571 | $5,849 | $15,722 |
| 2015 | $2,248 | $19,306 | $5,235 | $14,071 |
| 2014 | $2,750 | $21,790 | $5,010 | $16,780 |
| 2012 | $3,628 | $23,608 | $5,428 | $18,180 |
Source: Public Records
Map
Nearby Homes
- 308 W Greenwood Ave
- 1525 North Ave
- 722 W Keith Ave
- 86 Mariposa Ave
- 1810 N Jackson St
- 1126 N Ash St
- 1832 N Jackson St
- 1318 N Jackson St
- 634 W Ridgeland Ave
- 1810 Linden Ave
- 918 N Ash St
- 1020 Woodlawn Ave
- 705 Massena Ave
- 1105 Woodlawn Cir
- 728 N Ash St
- 214 Franklin St
- 1000 Massena Ave
- 520 N County St
- 1504 W Glen Flora Ave
- 302 Cory Ave
- 106 E Keith Ave
- 112 E Keith Ave
- 1701 Circle Ct
- 1709 Circle Ct
- 116 E Keith Ave
- 1711 Circle Ct
- 1627 Circle Ct
- 103 E Keith Ave
- 120 E Keith Ave
- 105 E Keith Ave
- 1621 Circle Ct
- 111 E Keith Ave
- 124 E Keith Ave
- 115 E Keith Ave
- 1619 Circle Ct
- 119 E Keith Ave
- 1608 Circle Ct
- 126 E Keith Ave
- 1611 Circle Ct
- 123 E Keith Ave
Your Personal Tour Guide
Ask me questions while you tour the home.