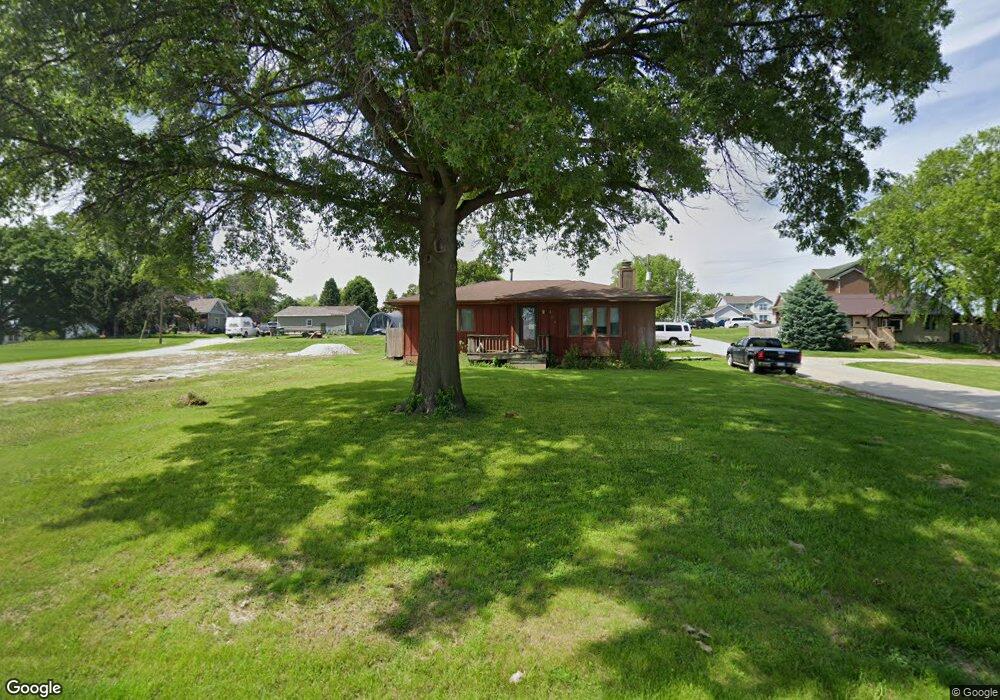
104 E Maple St Runnells, IA 50237
Estimated Value: $200,000 - $262,000
2
Beds
2
Baths
1,084
Sq Ft
$219/Sq Ft
Est. Value
About This Home
This home is located at 104 E Maple St, Runnells, IA 50237 and is currently estimated at $237,759, approximately $219 per square foot. 104 E Maple St is a home located in Polk County with nearby schools including Runnells Elementary School, Southeast Polk Spring Creek- 6th Grade, and Southeast Polk Junior High School.
Ownership History
Date
Name
Owned For
Owner Type
Purchase Details
Closed on
Jun 28, 2005
Sold by
Jayne Candi Marie and Heaberlin Candi Marie
Bought by
Brown Timothy J and Brown Jennifer S
Current Estimated Value
Home Financials for this Owner
Home Financials are based on the most recent Mortgage that was taken out on this home.
Original Mortgage
$115,200
Outstanding Balance
$60,528
Interest Rate
5.86%
Mortgage Type
Fannie Mae Freddie Mac
Estimated Equity
$177,231
Purchase Details
Closed on
Nov 20, 2002
Sold by
Heaberlin Joel Patrick
Bought by
Jayne Candi Marie and Heaberlin Candi Marie
Home Financials for this Owner
Home Financials are based on the most recent Mortgage that was taken out on this home.
Original Mortgage
$83,000
Interest Rate
6.08%
Purchase Details
Closed on
Apr 14, 1997
Sold by
Penman Cynthia L
Bought by
Heaberlin Joel
Home Financials for this Owner
Home Financials are based on the most recent Mortgage that was taken out on this home.
Original Mortgage
$82,100
Interest Rate
8.05%
Create a Home Valuation Report for This Property
The Home Valuation Report is an in-depth analysis detailing your home's value as well as a comparison with similar homes in the area
Purchase History
| Date | Buyer | Sale Price | Title Company |
|---|---|---|---|
| Brown Timothy J | $127,500 | -- | |
| Jayne Candi Marie | -- | -- | |
| Heaberlin Joel | $86,000 | -- |
Source: Public Records
Mortgage History
| Date | Status | Borrower | Loan Amount |
|---|---|---|---|
| Open | Brown Timothy J | $115,200 | |
| Previous Owner | Jayne Candi Marie | $83,000 | |
| Previous Owner | Heaberlin Joel | $82,100 |
Source: Public Records
Tax History
| Year | Tax Paid | Tax Assessment Tax Assessment Total Assessment is a certain percentage of the fair market value that is determined by local assessors to be the total taxable value of land and additions on the property. | Land | Improvement |
|---|---|---|---|---|
| 2025 | $3,520 | $235,800 | $33,400 | $202,400 |
| 2024 | $3,520 | $211,400 | $29,400 | $182,000 |
| 2023 | $3,414 | $211,400 | $29,400 | $182,000 |
| 2022 | $3,370 | $179,500 | $25,500 | $154,000 |
| 2021 | $3,156 | $179,500 | $25,500 | $154,000 |
| 2020 | $3,102 | $161,100 | $22,800 | $138,300 |
| 2019 | $2,978 | $161,100 | $22,800 | $138,300 |
| 2018 | $2,982 | $144,400 | $20,000 | $124,400 |
| 2017 | $3,068 | $144,400 | $20,000 | $124,400 |
| 2016 | $3,052 | $133,700 | $18,400 | $115,300 |
| 2015 | $3,052 | $133,700 | $18,400 | $115,300 |
| 2014 | $3,014 | $132,900 | $17,900 | $115,000 |
Source: Public Records
Map
Nearby Homes
- 203 Brown St
- 303 W Mckinney St
- 12028 SE 64th Ave
- 3333 220th Ave
- 2493 SE 108th St
- 2360 SE 108th St
- 3380 SE 96th St
- 0 S 128th Ave W
- 10579 W 129th St S
- 1462 108th St SE
- 410 N Vine St
- 2456 SE 88th St
- 7930 SE Vandalia Dr
- 24479 Elthon Place
- 3350 SE 82nd St
- 7820 SE Vandalia Dr
- 2496 SE 83rd Ct
- 3356 SE 82nd St
- 2511 SE 82nd St
- 6335 S31 Hwy
Your Personal Tour Guide
Ask me questions while you tour the home.