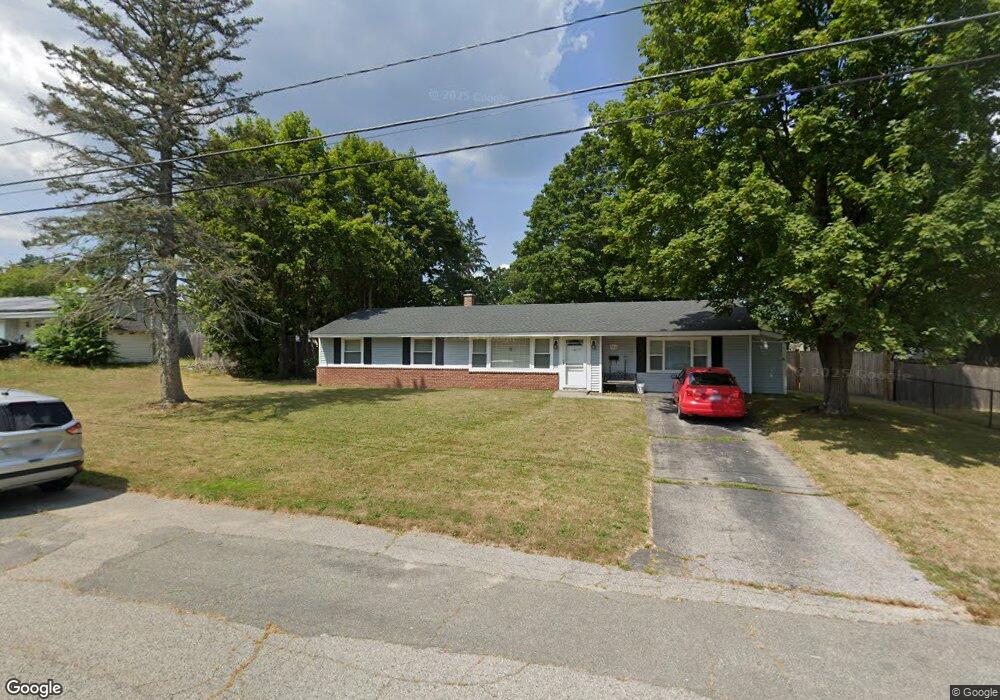
104 Errol Rd Brockton, MA 02302
Estimated Value: $398,000 - $515,000
3
Beds
2
Baths
1,452
Sq Ft
$319/Sq Ft
Est. Value
About This Home
This home is located at 104 Errol Rd, Brockton, MA 02302 and is currently estimated at $463,109, approximately $318 per square foot. 104 Errol Rd is a home located in Plymouth County with nearby schools including Brookfield Elementary School, Downey Elementary School, and Ashfield Middle School.
Ownership History
Date
Name
Owned For
Owner Type
Purchase Details
Closed on
Jun 24, 2022
Sold by
Cirino Santiago
Bought by
Cirino Jose M
Current Estimated Value
Home Financials for this Owner
Home Financials are based on the most recent Mortgage that was taken out on this home.
Original Mortgage
$332,500
Outstanding Balance
$315,558
Interest Rate
5.3%
Mortgage Type
Purchase Money Mortgage
Estimated Equity
$147,551
Purchase Details
Closed on
Aug 10, 1994
Sold by
Citizens Bk Of Mass
Bought by
Cirino Santiago
Home Financials for this Owner
Home Financials are based on the most recent Mortgage that was taken out on this home.
Original Mortgage
$54,000
Interest Rate
8.52%
Mortgage Type
Purchase Money Mortgage
Purchase Details
Closed on
Jan 26, 1994
Sold by
Santos Manuel P
Bought by
Citizens Bk Of Mass
Purchase Details
Closed on
Oct 27, 1988
Sold by
Lymberopoulo Ambros
Bought by
Santos Manuel P
Create a Home Valuation Report for This Property
The Home Valuation Report is an in-depth analysis detailing your home's value as well as a comparison with similar homes in the area
Home Values in the Area
Average Home Value in this Area
Purchase History
| Date | Buyer | Sale Price | Title Company |
|---|---|---|---|
| Cirino Jose M | $350,000 | None Available | |
| Cirino Santiago | $60,000 | -- | |
| Cirino Santiago | $60,000 | -- | |
| Citizens Bk Of Mass | $61,500 | -- | |
| Citizens Bk Of Mass | $61,500 | -- | |
| Santos Manuel P | $125,000 | -- |
Source: Public Records
Mortgage History
| Date | Status | Borrower | Loan Amount |
|---|---|---|---|
| Open | Cirino Jose M | $332,500 | |
| Previous Owner | Santos Manuel P | $48,000 | |
| Previous Owner | Santos Manuel P | $54,000 |
Source: Public Records
Tax History Compared to Growth
Tax History
| Year | Tax Paid | Tax Assessment Tax Assessment Total Assessment is a certain percentage of the fair market value that is determined by local assessors to be the total taxable value of land and additions on the property. | Land | Improvement |
|---|---|---|---|---|
| 2025 | $5,012 | $413,900 | $145,000 | $268,900 |
| 2024 | $4,904 | $408,000 | $145,000 | $263,000 |
| 2023 | $4,816 | $371,000 | $110,000 | $261,000 |
| 2022 | $4,321 | $309,300 | $100,000 | $209,300 |
| 2021 | $4,231 | $291,800 | $95,000 | $196,800 |
| 2020 | $4,150 | $273,900 | $91,000 | $182,900 |
| 2019 | $3,835 | $246,800 | $85,500 | $161,300 |
| 2018 | $3,399 | $228,900 | $85,500 | $143,400 |
| 2017 | $3,399 | $211,100 | $85,500 | $125,600 |
| 2016 | $3,184 | $183,400 | $81,500 | $101,900 |
| 2015 | $3,027 | $166,800 | $81,500 | $85,300 |
| 2014 | $3,020 | $166,600 | $81,500 | $85,100 |
Source: Public Records
Map
Nearby Homes