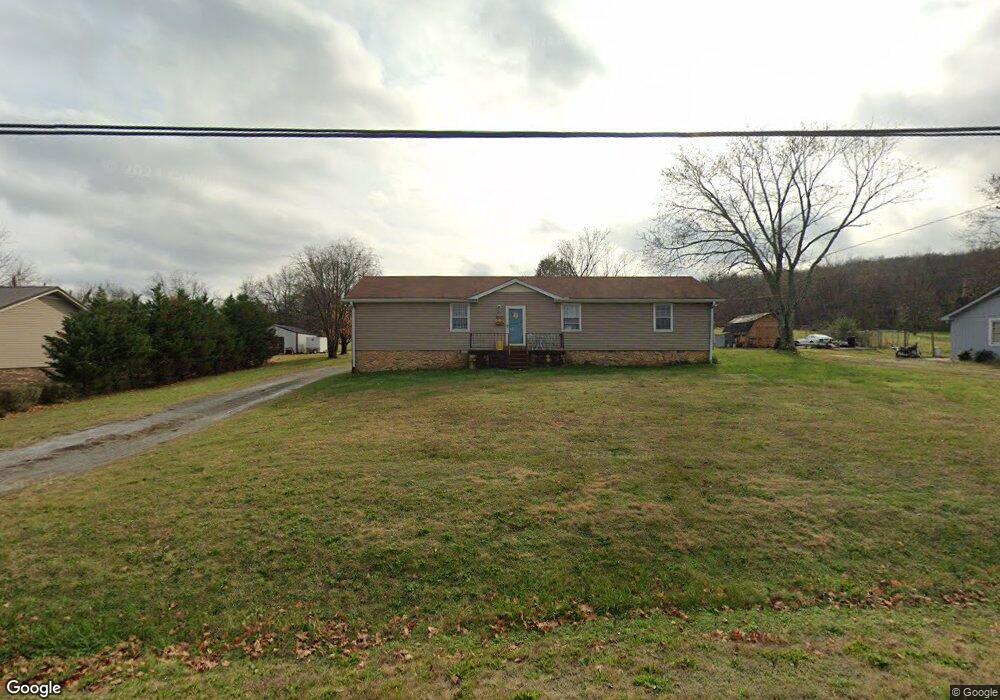
104 Fontenay Dr Lebanon, TN 37090
Estimated Value: $257,656 - $450,000
--
Bed
2
Baths
1,200
Sq Ft
$284/Sq Ft
Est. Value
About This Home
This home is located at 104 Fontenay Dr, Lebanon, TN 37090 and is currently estimated at $340,414, approximately $283 per square foot. 104 Fontenay Dr is a home located in Wilson County with nearby schools including Walter J. Baird Middle School, Lebanon High School, and Cedars Preparatory Academy.
Ownership History
Date
Name
Owned For
Owner Type
Purchase Details
Closed on
Sep 25, 2009
Sold by
Peplinski James A
Bought by
Dodge Julianna R
Current Estimated Value
Home Financials for this Owner
Home Financials are based on the most recent Mortgage that was taken out on this home.
Original Mortgage
$93,279
Outstanding Balance
$60,972
Interest Rate
5.1%
Estimated Equity
$279,442
Purchase Details
Closed on
Jul 21, 2003
Bought by
Peplinski James A
Home Financials for this Owner
Home Financials are based on the most recent Mortgage that was taken out on this home.
Original Mortgage
$50,800
Interest Rate
5.16%
Purchase Details
Closed on
Feb 14, 2003
Bought by
Sec Of Hud %Golden Feather Realty
Purchase Details
Closed on
Oct 5, 1995
Bought by
Winfree Sandra S
Purchase Details
Closed on
Jun 29, 1989
Bought by
Gann Charles
Purchase Details
Closed on
May 30, 1986
Bought by
Gann Charles
Create a Home Valuation Report for This Property
The Home Valuation Report is an in-depth analysis detailing your home's value as well as a comparison with similar homes in the area
Home Values in the Area
Average Home Value in this Area
Purchase History
| Date | Buyer | Sale Price | Title Company |
|---|---|---|---|
| Dodge Julianna R | $95,000 | -- | |
| Peplinski James A | $63,500 | -- | |
| Sec Of Hud %Golden Feather Realty | $73,100 | -- | |
| Winfree Sandra S | $70,000 | -- | |
| Gann Charles | -- | -- | |
| Gann Charles | -- | -- |
Source: Public Records
Mortgage History
| Date | Status | Borrower | Loan Amount |
|---|---|---|---|
| Open | Gann Charles | $93,279 | |
| Previous Owner | Gann Charles | $50,800 |
Source: Public Records
Tax History Compared to Growth
Tax History
| Year | Tax Paid | Tax Assessment Tax Assessment Total Assessment is a certain percentage of the fair market value that is determined by local assessors to be the total taxable value of land and additions on the property. | Land | Improvement |
|---|---|---|---|---|
| 2024 | $1,060 | $48,025 | $15,000 | $33,025 |
| 2022 | $1,056 | $47,875 | $15,000 | $32,875 |
| 2021 | $1,056 | $47,875 | $15,000 | $32,875 |
| 2020 | $774 | $47,875 | $15,000 | $32,875 |
| 2019 | $774 | $26,675 | $9,550 | $17,125 |
| 2018 | $774 | $26,675 | $9,550 | $17,125 |
| 2017 | $774 | $26,675 | $9,550 | $17,125 |
| 2016 | $774 | $26,675 | $9,550 | $17,125 |
| 2015 | $686 | $26,675 | $9,550 | $17,125 |
| 2014 | $647 | $25,160 | $0 | $0 |
Source: Public Records
Map
Nearby Homes
- 137 Sara Cir
- 0 Eastover Rd Unit RTC2677879
- 1556 Sparta Pike
- 124 Mill Rd
- 3720 SE Tater Peeler Rd
- 0 Sparta Pike Unit RTC2922733
- 2600 SE Tater Peeler Rd
- 612 Tater Peeler Rd
- 667 Eastover Rd
- 717 Peyton Rd
- 722 Park Ave
- 3663 Cainsville Rd
- 0 SE Tater Peeler Rd
- 3056 SE Tater Peeler Rd
- 1137 Fiona Dr
- 110 E Adams Ave
- 113 Holloway Dr
- 905 Mill Rd
- Gatlinburg Plan at One Lebanon Place - Avenue Collection
- 424 Seneca St
- 102 Fontenay Dr
- 106 Fontenay Dr
- 105 Fontenay Dr
- 103 Fontenay Dr
- 108 Fontenay Dr
- 2080 Cainsville Rd
- 2160 Cainsville Rd
- 109 Fontenay Dr
- 2120 Cainsville Rd
- 2034 Cainsville Rd
- 110 Fontenay Dr
- 111 Fontenay Dr
- 2140 Cainsville Rd
- 112 Fontenay Dr
- 2075 Cainsville Rd
- 113 Fontenay Dr
- 2135 Cainsville Rd
- 114 Fontenay Dr
- 115 Fontenay Dr
- 2200 Cainsville Rd