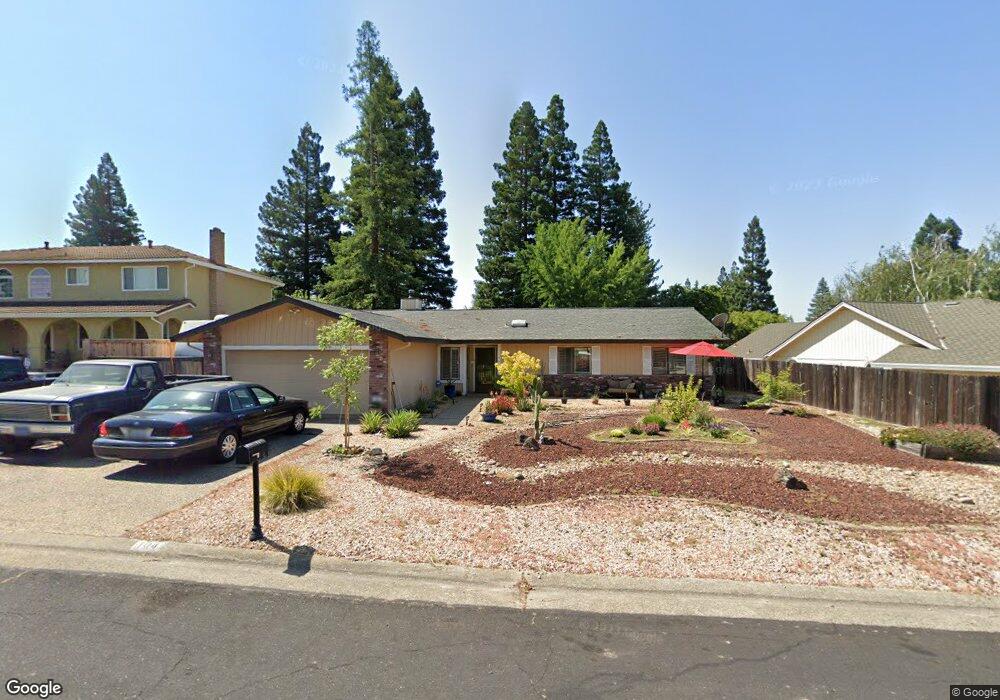
104 Gold Mine Ct Folsom, CA 95630
American River Canyon NeighborhoodEstimated Value: $740,507 - $774,000
3
Beds
2
Baths
1,843
Sq Ft
$414/Sq Ft
Est. Value
About This Home
This home is located at 104 Gold Mine Ct, Folsom, CA 95630 and is currently estimated at $762,377, approximately $413 per square foot. 104 Gold Mine Ct is a home located in Sacramento County with nearby schools including Carl H. Sundahl Elementary School, Sutter Middle School, and Folsom High School.
Ownership History
Date
Name
Owned For
Owner Type
Purchase Details
Closed on
Oct 9, 2023
Sold by
Hill Lesly G and Hill Brenda L
Bought by
Les And Brenda Hill 2023 Revocable Trust and Hill
Current Estimated Value
Purchase Details
Closed on
Jan 20, 2011
Sold by
Hagler Terri and The Bruce John Schinski Revoca
Bought by
Hill Lesly G and Hill Brenda L
Home Financials for this Owner
Home Financials are based on the most recent Mortgage that was taken out on this home.
Original Mortgage
$355,990
Interest Rate
4.75%
Mortgage Type
FHA
Purchase Details
Closed on
Oct 12, 2007
Sold by
Schinski Bruce J and Schinski Bruce John
Bought by
Schinski Bruce John and The Bruce John Schinski Revoca
Purchase Details
Closed on
Oct 31, 2002
Sold by
Jacobs James D and Jacobs Leslie M
Bought by
Schinski Bruce J
Home Financials for this Owner
Home Financials are based on the most recent Mortgage that was taken out on this home.
Original Mortgage
$292,760
Interest Rate
5.95%
Purchase Details
Closed on
Feb 27, 2002
Sold by
Jacobs James D and Jacobs Leslie M
Bought by
Jacobs James D and Jacobs Leslie M
Create a Home Valuation Report for This Property
The Home Valuation Report is an in-depth analysis detailing your home's value as well as a comparison with similar homes in the area
Home Values in the Area
Average Home Value in this Area
Purchase History
| Date | Buyer | Sale Price | Title Company |
|---|---|---|---|
| Les And Brenda Hill 2023 Revocable Trust | -- | None Listed On Document | |
| Les And Brenda Hill 2023 Revocable Trust | -- | None Listed On Document | |
| Hill Lesly G | $365,500 | Placer Title Company | |
| Schinski Bruce John | -- | None Available | |
| Schinski Bruce J | $366,000 | Financial Title Company | |
| Jacobs James D | -- | -- |
Source: Public Records
Mortgage History
| Date | Status | Borrower | Loan Amount |
|---|---|---|---|
| Previous Owner | Hill Lesly G | $355,990 | |
| Previous Owner | Schinski Bruce J | $292,760 |
Source: Public Records
Tax History Compared to Growth
Tax History
| Year | Tax Paid | Tax Assessment Tax Assessment Total Assessment is a certain percentage of the fair market value that is determined by local assessors to be the total taxable value of land and additions on the property. | Land | Improvement |
|---|---|---|---|---|
| 2025 | $4,999 | $467,939 | $230,607 | $237,332 |
| 2024 | $4,999 | $458,765 | $226,086 | $232,679 |
| 2023 | $4,910 | $449,770 | $221,653 | $228,117 |
| 2022 | $4,839 | $440,952 | $217,307 | $223,645 |
| 2021 | $4,774 | $432,307 | $213,047 | $219,260 |
| 2020 | $4,715 | $427,875 | $210,863 | $217,012 |
| 2019 | $4,637 | $419,486 | $206,729 | $212,757 |
| 2018 | $4,522 | $411,262 | $202,676 | $208,586 |
| 2017 | $4,217 | $403,199 | $198,702 | $204,497 |
| 2016 | $4,406 | $395,294 | $194,806 | $200,488 |
| 2015 | $4,258 | $389,357 | $191,880 | $197,477 |
| 2014 | $4,042 | $381,731 | $188,122 | $193,609 |
Source: Public Records
Map
Nearby Homes
- 103 S Fork Way
- 134 Gold Creek Cir
- 203 Crow Canyon Dr
- 106 Oak Rim Way
- 621 Landrise Ct
- 600 Landrise Ct
- 116 Pheasant Ln
- 7314 Santa Juanita Ave
- 7230 Pine Grove Way
- 413 Marsalla Dr
- 303 Marsalla Dr
- 115 American River Canyon Dr
- 119 Del Norte Vista Way
- 105 Eagle Creek Ct
- 147 American River Canyon Dr
- 1122 River Rock Dr
- 0 Folsom-Auburn Rd
- 172 Lost Creek Dr
- 7400 Mountain Ave
- 73 Redwood Ln
- 106 Gold Mine Ct
- 102 Gold Mine Ct
- 105 Middle Fork Ct
- 107 Middle Fork Ct
- 108 Gold Mine Ct
- 105 Gold Mine Ct
- 100 Gold Mine Ct
- 103 Gold Mine Ct
- 103 Middle Fork Ct
- 109 Middle Fork Ct
- 107 Gold Mine Ct
- 101 Gold Mine Ct
- 110 Gold Mine Ct
- 109 Gold Mine Ct
- 111 Middle Fork Ct
- 113 Blue Canyon Way
- 153 Canyon Rim Dr
- 108 Middle Fork Ct
- 149 Canyon Rim Dr
- 106 Middle Fork Ct