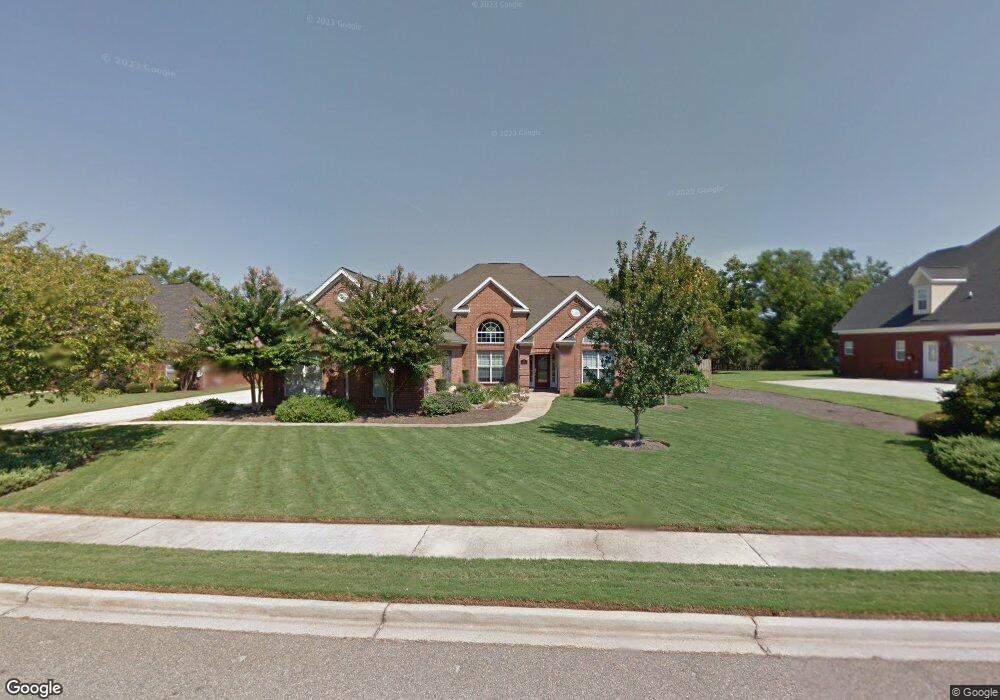
104 Grove Ct Centerville, GA 31028
Estimated Value: $416,243 - $448,000
5
Beds
3
Baths
2,573
Sq Ft
$168/Sq Ft
Est. Value
About This Home
This home is located at 104 Grove Ct, Centerville, GA 31028 and is currently estimated at $431,311, approximately $167 per square foot. 104 Grove Ct is a home located in Houston County with nearby schools including Eagle Springs Elementary School, Thomson Middle School, and Northside High School.
Ownership History
Date
Name
Owned For
Owner Type
Purchase Details
Closed on
Mar 6, 2019
Sold by
Chadwick Denise M
Bought by
Trawick John A
Current Estimated Value
Home Financials for this Owner
Home Financials are based on the most recent Mortgage that was taken out on this home.
Original Mortgage
$268,000
Outstanding Balance
$235,618
Interest Rate
4.4%
Mortgage Type
VA
Estimated Equity
$195,693
Purchase Details
Closed on
Oct 22, 2007
Sold by
Chadwick David M
Bought by
Chadwick Denice M
Purchase Details
Closed on
Jul 14, 2006
Sold by
Faulkner Wayne B
Bought by
Rosequist Rebekah Eldean and Faulkner Rebekah E
Purchase Details
Closed on
Jan 21, 2000
Sold by
Hilbert Properties Inc
Bought by
Chadwick David M and Denise M*
Purchase Details
Closed on
Aug 4, 1999
Sold by
Eagle Springs Llc
Bought by
Hilbert Properties Inc
Create a Home Valuation Report for This Property
The Home Valuation Report is an in-depth analysis detailing your home's value as well as a comparison with similar homes in the area
Home Values in the Area
Average Home Value in this Area
Purchase History
| Date | Buyer | Sale Price | Title Company |
|---|---|---|---|
| Trawick John A | $268,000 | None Available | |
| Chadwick Denice M | -- | None Available | |
| Rosequist Rebekah Eldean | -- | None Available | |
| Chadwick David M | $242,500 | -- | |
| Hilbert Properties Inc | $37,000 | -- |
Source: Public Records
Mortgage History
| Date | Status | Borrower | Loan Amount |
|---|---|---|---|
| Open | Trawick John A | $268,000 |
Source: Public Records
Tax History
| Year | Tax Paid | Tax Assessment Tax Assessment Total Assessment is a certain percentage of the fair market value that is determined by local assessors to be the total taxable value of land and additions on the property. | Land | Improvement |
|---|---|---|---|---|
| 2024 | $5,300 | $152,800 | $15,800 | $137,000 |
| 2023 | $4,364 | $124,920 | $15,800 | $109,120 |
| 2022 | $2,726 | $118,560 | $15,800 | $102,760 |
| 2021 | $2,478 | $107,200 | $15,800 | $91,400 |
| 2020 | $2,490 | $109,120 | $18,000 | $91,120 |
| 2019 | $2,424 | $106,320 | $18,000 | $88,320 |
| 2018 | $2,342 | $102,800 | $18,000 | $84,800 |
| 2017 | $2,344 | $102,800 | $18,000 | $84,800 |
| 2016 | $2,348 | $102,800 | $18,000 | $84,800 |
| 2015 | $2,353 | $102,800 | $18,000 | $84,800 |
| 2014 | -- | $102,680 | $18,000 | $84,680 |
| 2013 | -- | $103,960 | $16,000 | $87,960 |
Source: Public Records
Map
Nearby Homes
- 509 Saint Marlo Dr
- 209 Trellis Walk
- 106 Bretwood Ct
- 116 Tivoli Park Rd
- 111 Montrose Ln
- 115 Montrose Ln
- 132 Montrose Ln
- 103 Westoak Ct
- 100 Jamestown Ct
- 105 Park Ln
- 104 Orchard Ln
- 202 Bassett St
- 107 Miller Ct
- 102 Macintosh Ln
- 208 Bassett St
- 119 Bartlett Way
- 304 Montview Way
- 102 Lee St Unit 117 Wilson Drive
- 102 Lee St
- 112 Knights Bridge
Your Personal Tour Guide
Ask me questions while you tour the home.