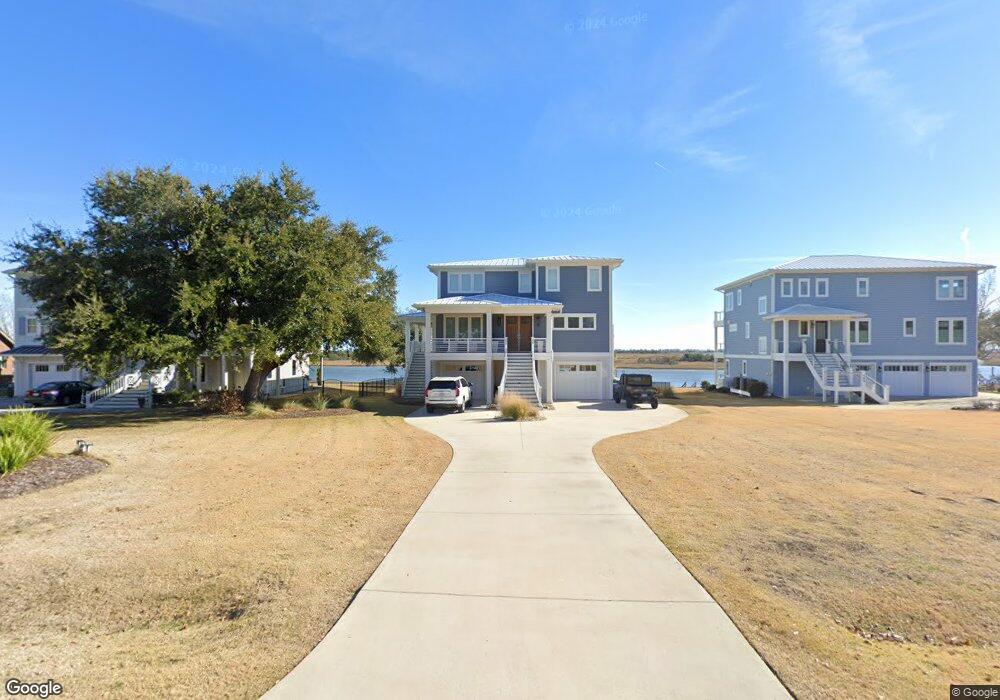
104 Inlet Ct Hampstead, NC 28443
Estimated Value: $1,139,000 - $1,274,163
4
Beds
6
Baths
4,024
Sq Ft
$303/Sq Ft
Est. Value
About This Home
This home is located at 104 Inlet Ct, Hampstead, NC 28443 and is currently estimated at $1,217,791, approximately $302 per square foot. 104 Inlet Ct is a home with nearby schools including Topsail Elementary School, Topsail Middle School, and Topsail High School.
Ownership History
Date
Name
Owned For
Owner Type
Purchase Details
Closed on
Apr 19, 2021
Sold by
Williams Michael S and Williams Natashia B
Bought by
Williams Michael S and Williams Natashia B
Current Estimated Value
Home Financials for this Owner
Home Financials are based on the most recent Mortgage that was taken out on this home.
Original Mortgage
$743,500
Outstanding Balance
$558,643
Interest Rate
3.05%
Mortgage Type
New Conventional
Estimated Equity
$659,148
Purchase Details
Closed on
Feb 6, 2016
Sold by
Colonial Capital Real Estate Llc
Bought by
Williams Michael S
Home Financials for this Owner
Home Financials are based on the most recent Mortgage that was taken out on this home.
Original Mortgage
$249,999
Interest Rate
3.98%
Mortgage Type
Future Advance Clause Open End Mortgage
Purchase Details
Closed on
Apr 8, 2006
Sold by
Bradshaw Elaine Allen and Talou Patrick M
Bought by
Bradshaw Howard Holt
Create a Home Valuation Report for This Property
The Home Valuation Report is an in-depth analysis detailing your home's value as well as a comparison with similar homes in the area
Home Values in the Area
Average Home Value in this Area
Purchase History
| Date | Buyer | Sale Price | Title Company |
|---|---|---|---|
| Williams Michael S | -- | Ravenswood Title Company Llc | |
| Williams Michael S | $350,000 | None Available | |
| Bradshaw Howard Holt | $1,100,000 | -- |
Source: Public Records
Mortgage History
| Date | Status | Borrower | Loan Amount |
|---|---|---|---|
| Open | Williams Michael S | $743,500 | |
| Closed | Williams Michael S | $249,999 |
Source: Public Records
Tax History Compared to Growth
Tax History
| Year | Tax Paid | Tax Assessment Tax Assessment Total Assessment is a certain percentage of the fair market value that is determined by local assessors to be the total taxable value of land and additions on the property. | Land | Improvement |
|---|---|---|---|---|
| 2024 | $6,035 | $630,803 | $108,206 | $522,597 |
| 2023 | $5,471 | $630,803 | $108,206 | $522,597 |
| 2022 | $5,471 | $630,803 | $108,206 | $522,597 |
| 2021 | $5,471 | $630,803 | $108,206 | $522,597 |
| 2020 | $5,331 | $613,883 | $108,206 | $505,677 |
| 2019 | $5,331 | $613,883 | $108,206 | $505,677 |
| 2018 | $2,790 | $867,131 | $338,580 | $528,551 |
| 2017 | $2,790 | $319,770 | $319,770 | $0 |
| 2016 | $2,758 | $319,770 | $319,770 | $0 |
| 2015 | $2,758 | $319,770 | $319,770 | $0 |
| 2014 | $2,141 | $319,770 | $319,770 | $0 |
| 2013 | -- | $319,770 | $319,770 | $0 |
| 2012 | -- | $319,770 | $319,770 | $0 |
Source: Public Records
Map
Nearby Homes
- 110 Inlet Ct
- 640 Avila Dr
- 104 Treasure Way
- 50 Ransom Dr
- 113 Bellowing Doe Rd
- 1406 Kings Landing Rd
- 115 Dolphin Dr
- 1475 Kings Landing Rd
- 1144 Avila Dr
- 1020 Cordgrass Rd
- 0 Cordgrass Rd
- 557 Button Bush Ln
- 147 Pine Needle Dr
- 480 Captain Beam Blvd
- 131 Sound View Dr
- 1966 Kings Landing Rd
- 1984 Kings Landing Rd
- 605 Sawgrass Rd
- 136 S Belvedere Dr
- 709 Sawgrass Rd
- 106 Inlet Ct
- 102 Inlet Ct
- 0 Inlet Ct
- Lot 3 Inlet Ct
- 3 Inlet Ct
- 8 Scotch Bonnet Way
- 4 Scotch Bonnet Way
- 5 Scotch Bonnet Way
- 134 Inlet Ct
- 100 Inlet Ct
- 4 Inlet Ct
- 103 Inlet Ct Unit 1
- 101 Inlet Ct
- 105 Inlet Ct
- 107 Inlet Ct
- 91 Scotch Bonnet Way
- 112 Inlet Ct
- 250 Kings Landing Ct
- 208 Kings Landing Ct
- 206 Kings Landing Ct