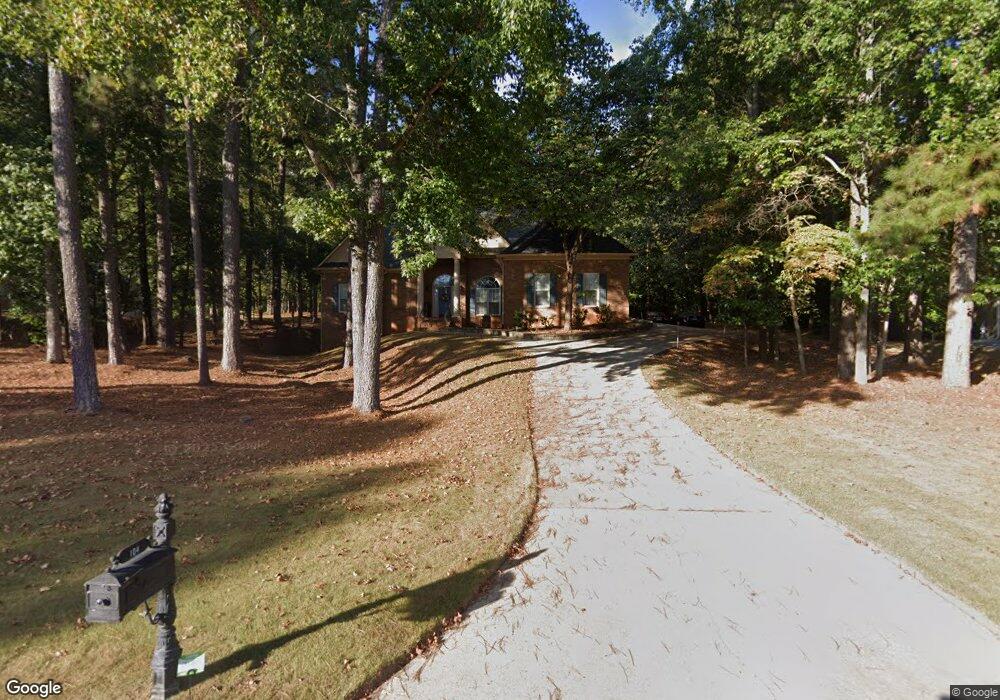
104 Interlochen Dr Peachtree City, GA 30269
Estimated Value: $657,000 - $745,000
4
Beds
3
Baths
2,633
Sq Ft
$263/Sq Ft
Est. Value
About This Home
This home is located at 104 Interlochen Dr, Peachtree City, GA 30269 and is currently estimated at $692,017, approximately $262 per square foot. 104 Interlochen Dr is a home located in Fayette County with nearby schools including Kedron Elementary School, Booth Middle School, and McIntosh High School.
Ownership History
Date
Name
Owned For
Owner Type
Purchase Details
Closed on
Jun 18, 2019
Sold by
Colborn Michael
Bought by
Bestul Joseph H and Colborn Sheryl A
Current Estimated Value
Home Financials for this Owner
Home Financials are based on the most recent Mortgage that was taken out on this home.
Original Mortgage
$388,292
Outstanding Balance
$340,711
Interest Rate
4%
Estimated Equity
$351,306
Purchase Details
Closed on
Sep 5, 2000
Sold by
Colborn Michael
Bought by
Colburn Michael and Colburn Sheryl A
Purchase Details
Closed on
Sep 7, 1998
Sold by
Thibadoux Stanley R and Thibadoux Marcia O
Bought by
Colborn Michael and Colborn Sheryl A
Home Financials for this Owner
Home Financials are based on the most recent Mortgage that was taken out on this home.
Original Mortgage
$80,000
Interest Rate
6.12%
Mortgage Type
New Conventional
Create a Home Valuation Report for This Property
The Home Valuation Report is an in-depth analysis detailing your home's value as well as a comparison with similar homes in the area
Home Values in the Area
Average Home Value in this Area
Purchase History
| Date | Buyer | Sale Price | Title Company |
|---|---|---|---|
| Bestul Joseph H | $412,000 | -- | |
| Colburn Michael | -- | -- | |
| Colborn Michael | $294,000 | -- |
Source: Public Records
Mortgage History
| Date | Status | Borrower | Loan Amount |
|---|---|---|---|
| Open | Bestul Joseph H | $388,292 | |
| Previous Owner | Colborn Michael | $80,000 |
Source: Public Records
Tax History Compared to Growth
Tax History
| Year | Tax Paid | Tax Assessment Tax Assessment Total Assessment is a certain percentage of the fair market value that is determined by local assessors to be the total taxable value of land and additions on the property. | Land | Improvement |
|---|---|---|---|---|
| 2024 | $5,818 | $231,592 | $47,500 | $184,092 |
| 2023 | $5,413 | $234,060 | $47,500 | $186,560 |
| 2022 | $5,513 | $205,020 | $47,500 | $157,520 |
| 2021 | $5,350 | $191,980 | $47,500 | $144,480 |
| 2020 | $5,056 | $164,800 | $43,240 | $121,560 |
| 2019 | $3,683 | $175,700 | $47,500 | $128,200 |
| 2018 | $3,668 | $172,180 | $47,500 | $124,680 |
| 2017 | $3,399 | $158,100 | $47,500 | $110,600 |
| 2016 | $3,331 | $147,580 | $47,500 | $100,080 |
| 2015 | $3,270 | $142,580 | $47,500 | $95,080 |
| 2014 | $3,150 | $134,580 | $47,500 | $87,080 |
| 2013 | -- | $137,180 | $0 | $0 |
Source: Public Records
Map
Nearby Homes
- 330 N Peachtree Pkwy
- 221 N Cove Dr
- 103 Greensway
- 108 Madison Ave
- 106 Sandtrap Ridge
- 124 Middleton Dr
- 101 Parkway Dr
- 1000 Blair Ln
- 930 Laurel Brooke Ave
- 606 Wingspread
- 226 Collierstown Way
- 527 Hazelnut Dr
- 235 Collierstown Way
- 168 Maple Grove Terrace
- 164 Maple Grove Terrace
- 406 Daker Dr
- 905 Lexington Village
- 940 Laurel Brooke Ave
- Level Three Plan at Laurel Brooke - The Enclave at Laurel Brooke
- Level Two Plan at Laurel Brooke - The Enclave at Laurel Brooke
- 106 Interlochen Dr
- 102 Interlochen Dr
- 1003 Walt Banks Rd
- 108 Interlochen Dr
- 100 Interlochen Dr
- 1001 Walt Banks Rd
- 103 Interlochen Dr
- 1005 Walt Banks Rd
- 101 Interlochen Dr
- 101 Interlochen Dr Unit 69
- 901 Walt Banks Rd
- 110 Interlochen Dr
- 915 Walt Banks Rd
- 105 Interlochen Dr
- 107 Interlochen Dr
- 1007 Walt Banks Rd
- 321 N Peachtree Pkwy
- 112 Interlochen Dr
- 399 N Peachtree Pkwy
- 109 Interlochen Dr