Estimated Value: $755,317 - $792,000
4
Beds
3
Baths
3,090
Sq Ft
$250/Sq Ft
Est. Value
About This Home
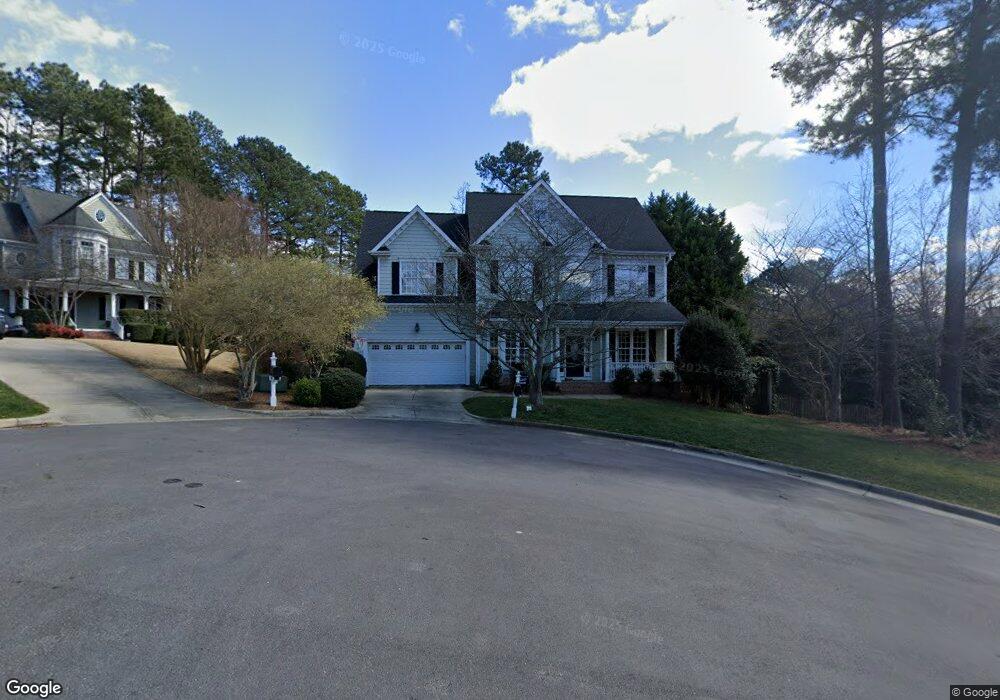
This home is located at 104 Latheron Ct, Apex, NC 27502 and is currently estimated at $772,579, approximately $250 per square foot. 104 Latheron Ct is a home located in Wake County with nearby schools including Scotts Ridge Elementary School, Apex Middle, and Apex High School.
Ownership History
Date
Name
Owned For
Owner Type
Purchase Details
Closed on
Jan 8, 2010
Sold by
Boozi Brian J and Boozi Tenya O
Bought by
Smith Shawn T and Smith Eve E
Current Estimated Value
Home Financials for this Owner
Home Financials are based on the most recent Mortgage that was taken out on this home.
Original Mortgage
$280,000
Outstanding Balance
$181,961
Interest Rate
4.75%
Mortgage Type
New Conventional
Estimated Equity
$590,618
Purchase Details
Closed on
Apr 15, 2004
Sold by
Phil Stone Homes Inc
Bought by
Boezi Brian J and Boezi Tonya O
Home Financials for this Owner
Home Financials are based on the most recent Mortgage that was taken out on this home.
Original Mortgage
$185,000
Interest Rate
5.54%
Mortgage Type
Purchase Money Mortgage
Purchase Details
Closed on
Jan 8, 2002
Sold by
Gemmell Patrick and Gemmell Connie
Bought by
Phil Stone Homes Inc
Purchase Details
Closed on
Mar 26, 2001
Sold by
Cameron Park Associates Ii Llc
Bought by
Gemmell Patrick and Gemmell Connie
Create a Home Valuation Report for This Property
The Home Valuation Report is an in-depth analysis detailing your home's value as well as a comparison with similar homes in the area
Purchase History
| Date | Buyer | Sale Price | Title Company |
|---|---|---|---|
| Smith Shawn T | $350,000 | None Available | |
| Boezi Brian J | $292,000 | -- | |
| Phil Stone Homes Inc | $40,000 | -- | |
| Gemmell Patrick | $38,000 | -- |
Source: Public Records
Mortgage History
| Date | Status | Borrower | Loan Amount |
|---|---|---|---|
| Open | Smith Shawn T | $280,000 | |
| Previous Owner | Boezi Brian J | $185,000 |
Source: Public Records
Tax History
| Year | Tax Paid | Tax Assessment Tax Assessment Total Assessment is a certain percentage of the fair market value that is determined by local assessors to be the total taxable value of land and additions on the property. | Land | Improvement |
|---|---|---|---|---|
| 2025 | $6,300 | $719,311 | $180,000 | $539,311 |
| 2024 | $6,159 | $719,311 | $180,000 | $539,311 |
Source: Public Records
Map
Nearby Homes
- 0 Jb Morgan Rd Unit 10051948
- 400 Village Loop Dr
- 101 Rocklyn Ln
- 1006 Cherokee Sunset Rd
- 440 Oak Pine Dr
- 1224 Tartarian Trail
- 470 Magdala Place
- 1008 Daresbury Dr
- 107 Maple Crest Ct
- 1303 Goldspot Ct
- 1913 Metta Mill Ln
- 111 Lemon Drop Cir
- 3021 White Cloud Cir
- 1210 Evian Ct
- 1866 Porch Swing Way
- 1880 Woodall Crest Dr
- 102 Licorice Dr
- 120 Licorice Dr
- 1216 Scotts Ridge Trail
- 203 Milky Way Dr
- 218 Vatersay Dr
- 220 Vatersay Dr
- 108 Latheron Ct
- 100 Latheron Ct
- 216 Vatersay Dr
- 222 Vatersay Dr
- 112 Latheron Ct
- 105 Latheron Ct
- 208 Vatersay Dr
- 109 Latheron Ct
- 300 Vatersay Dr
- 113 Latheron Ct
- 206 Vatersay Dr
- 219 Vatersay Dr
- 217 Vatersay Dr
- 221 Vatersay Dr
- 204 Vatersay Dr
- 223 Vatersay Dr
- 100 Gullane Ct
- 104 Gullane Ct
Your Personal Tour Guide
Ask me questions while you tour the home.