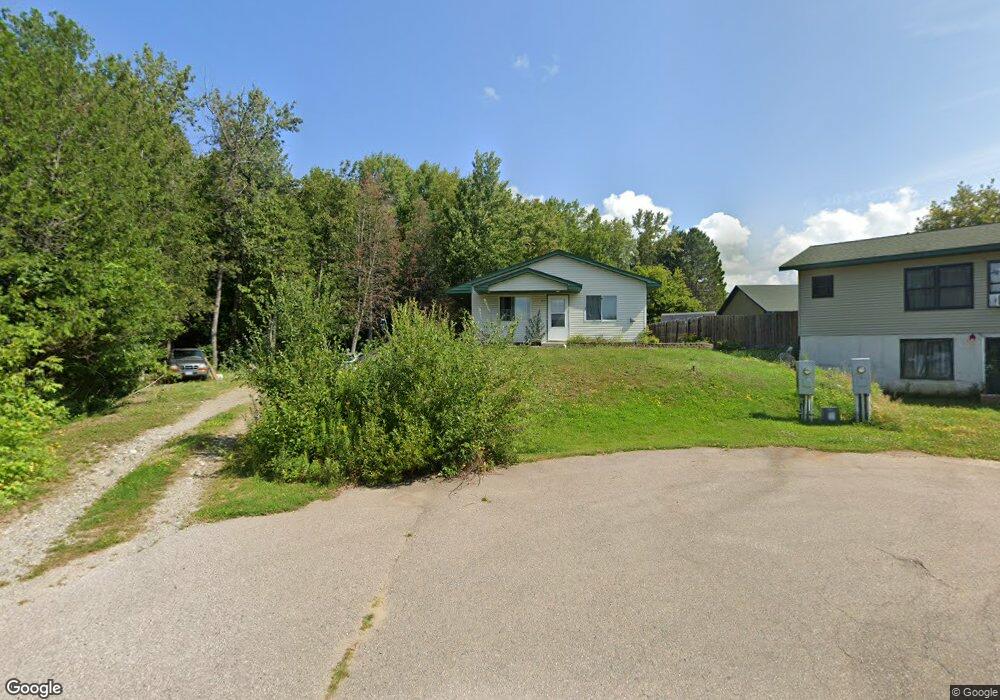
104 Mineview Ct Soudan, MN 55782
Soudan NeighborhoodEstimated Value: $94,000 - $162,000
3
Beds
2
Baths
1,092
Sq Ft
$124/Sq Ft
Est. Value
About This Home
This home is located at 104 Mineview Ct, Soudan, MN 55782 and is currently estimated at $135,926, approximately $124 per square foot. 104 Mineview Ct is a home with nearby schools including Tower-Soudan Elementary School and Vermilion Country School.
Ownership History
Date
Name
Owned For
Owner Type
Purchase Details
Closed on
Dec 8, 2025
Sold by
Westin Julie M
Bought by
Westin Jacob
Current Estimated Value
Home Financials for this Owner
Home Financials are based on the most recent Mortgage that was taken out on this home.
Original Mortgage
$95,000
Outstanding Balance
$95,000
Interest Rate
6.17%
Mortgage Type
VA
Estimated Equity
$40,926
Purchase Details
Closed on
Jan 29, 2009
Sold by
North St Louis County Habitat For Humani
Bought by
Westin Julie M
Home Financials for this Owner
Home Financials are based on the most recent Mortgage that was taken out on this home.
Original Mortgage
$20,000
Interest Rate
5.03%
Mortgage Type
Stand Alone Second
Purchase Details
Closed on
Jun 2, 2008
Sold by
Tower Economic Development Authority
Bought by
North St Louis County Habitat For Humani
Create a Home Valuation Report for This Property
The Home Valuation Report is an in-depth analysis detailing your home's value as well as a comparison with similar homes in the area
Home Values in the Area
Average Home Value in this Area
Purchase History
| Date | Buyer | Sale Price | Title Company |
|---|---|---|---|
| Westin Jacob | $95,000 | Northeast Title | |
| Westin Julie M | $125,000 | None Available | |
| North St Louis County Habitat For Humani | -- | None Available | |
| Tower Economic Development Authority | -- | None Available |
Source: Public Records
Mortgage History
| Date | Status | Borrower | Loan Amount |
|---|---|---|---|
| Open | Westin Jacob | $95,000 | |
| Previous Owner | Westin Julie M | $20,000 | |
| Previous Owner | Westin Julie M | $76,940 |
Source: Public Records
Tax History
| Year | Tax Paid | Tax Assessment Tax Assessment Total Assessment is a certain percentage of the fair market value that is determined by local assessors to be the total taxable value of land and additions on the property. | Land | Improvement |
|---|---|---|---|---|
| 2024 | $404 | $111,700 | $8,500 | $103,200 |
| 2023 | $404 | $115,800 | $8,500 | $107,300 |
| 2022 | $622 | $96,300 | $8,000 | $88,300 |
| 2021 | $620 | $91,700 | $7,600 | $84,100 |
| 2020 | $632 | $91,700 | $7,600 | $84,100 |
| 2019 | $380 | $92,000 | $7,600 | $84,400 |
| 2018 | $282 | $79,000 | $7,200 | $71,800 |
| 2017 | $310 | $68,300 | $6,500 | $61,800 |
| 2016 | $314 | $65,100 | $6,100 | $59,000 |
| 2015 | $341 | $39,000 | $3,700 | $35,300 |
| 2014 | $341 | $41,100 | $3,700 | $37,400 |
Source: Public Records
Map
Nearby Homes
Your Personal Tour Guide
Ask me questions while you tour the home.