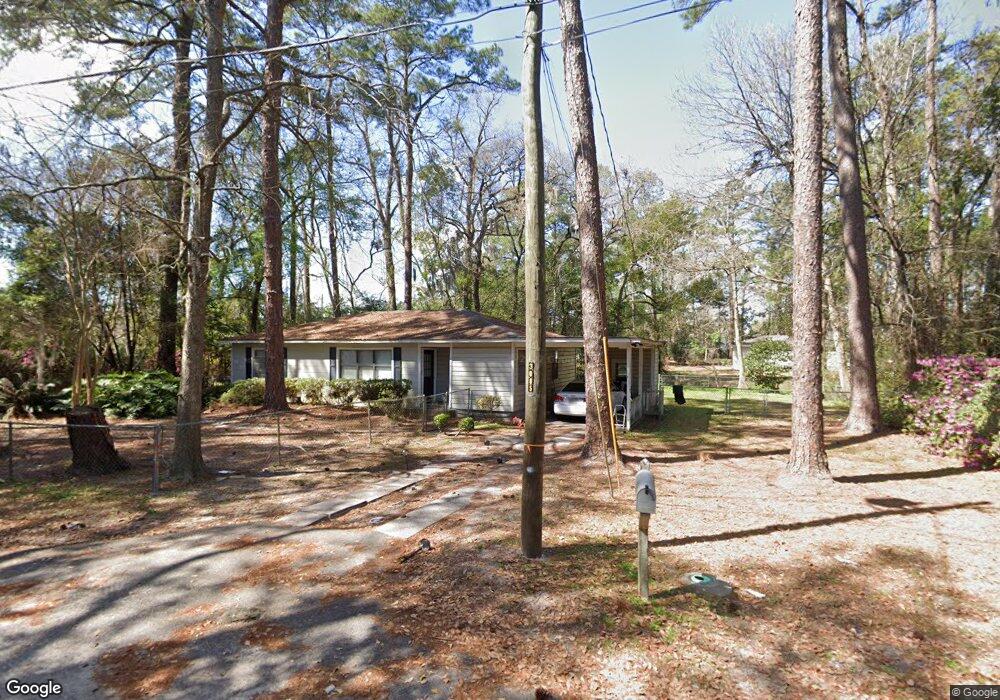
104 Moss Oak Dr Valdosta, GA 31601
Estimated Value: $122,350 - $167,000
3
Beds
1
Bath
1,249
Sq Ft
$109/Sq Ft
Est. Value
About This Home
This home is located at 104 Moss Oak Dr, Valdosta, GA 31601 and is currently estimated at $135,588, approximately $108 per square foot. 104 Moss Oak Dr is a home located in Lowndes County with nearby schools including S.L. Mason Elementary School, Valdosta Middle School, and Valdosta High School.
Ownership History
Date
Name
Owned For
Owner Type
Purchase Details
Closed on
Dec 13, 2005
Sold by
Real Estate Resolution
Bought by
Aranda Yanela
Current Estimated Value
Home Financials for this Owner
Home Financials are based on the most recent Mortgage that was taken out on this home.
Original Mortgage
$56,800
Outstanding Balance
$31,780
Interest Rate
6.29%
Mortgage Type
New Conventional
Estimated Equity
$103,808
Purchase Details
Closed on
Sep 21, 2005
Sold by
Reo Mangement 2002 Llc
Bought by
Real Estate Resolution
Purchase Details
Closed on
Mar 1, 2005
Sold by
Leonard Frank
Bought by
Reo Management 2002 Inc
Purchase Details
Closed on
Nov 1, 2000
Sold by
Clark John Scott
Bought by
Leonard Frank
Purchase Details
Closed on
Sep 8, 1997
Bought by
Clark John Scott
Purchase Details
Closed on
Nov 19, 1976
Bought by
Black Willie Joe Wilson
Create a Home Valuation Report for This Property
The Home Valuation Report is an in-depth analysis detailing your home's value as well as a comparison with similar homes in the area
Home Values in the Area
Average Home Value in this Area
Purchase History
| Date | Buyer | Sale Price | Title Company |
|---|---|---|---|
| Aranda Yanela | $71,000 | -- | |
| Real Estate Resolution | $34,750 | -- | |
| Reo Management 2002 Inc | -- | -- | |
| Leonard Frank | $59,900 | -- | |
| Clark John Scott | $37,800 | -- | |
| Black Willie Joe Wilson | $23,200 | -- |
Source: Public Records
Mortgage History
| Date | Status | Borrower | Loan Amount |
|---|---|---|---|
| Open | Aranda Yanela | $56,800 |
Source: Public Records
Tax History Compared to Growth
Tax History
| Year | Tax Paid | Tax Assessment Tax Assessment Total Assessment is a certain percentage of the fair market value that is determined by local assessors to be the total taxable value of land and additions on the property. | Land | Improvement |
|---|---|---|---|---|
| 2024 | $919 | $32,892 | $3,936 | $28,956 |
| 2023 | $919 | $32,892 | $3,936 | $28,956 |
| 2022 | $813 | $24,046 | $3,936 | $20,110 |
| 2021 | $836 | $24,046 | $3,936 | $20,110 |
| 2020 | $854 | $24,046 | $3,936 | $20,110 |
| 2019 | $854 | $24,046 | $3,936 | $20,110 |
| 2018 | $865 | $24,046 | $3,936 | $20,110 |
| 2017 | $871 | $24,046 | $3,936 | $20,110 |
| 2016 | $869 | $24,046 | $3,936 | $20,110 |
| 2015 | $798 | $24,046 | $3,936 | $20,110 |
| 2014 | $811 | $24,046 | $3,936 | $20,110 |
Source: Public Records
Map
Nearby Homes
- TBD Moss Oak Dr
- 316 Blitch St
- 230 Saint Augustine Rd
- 303 Nan St
- 219 N St Augustine Rd
- 211 Stella St
- 203 N Saint Augustine Rd
- 107 Jordan St
- 1400 Lankford Dr
- 1202 Melissa Dr
- 605 N Saint Augustine Rd
- 503 Roberts St
- 201 Norman Dr
- 1817 W Hill Ave
- 1815 W Hill Ave
- 2103 W Hill Ave
- Trx 4&5 W Hill Ave
- 1501 Harmon Dr
- 614 Lamar St
- 1114 Clark St
- 108 Moss Oak Dr
- 102 Moss Oak Dr
- 104 Holloway Dr
- 105 Hyde Park Ave
- 103 Hyde Park Ave
- LT3&4 Moss Oak Dr
- 107 Hyde Park Ave
- 100 Holloway Dr
- 0 Moss Oak Dr
- 112 Moss Oak Dr
- 109 Hyde Park Ave
- 107 Holloway Dr
- 109 Holloway Dr
- 1547 Weaver Dr
- 1545 Weaver Dr
- 1543 Weaver Dr
- 1518 River St Unit A
- 1551 Weaver Dr
- 1541 Weaver Dr
- 1553 Weaver Dr