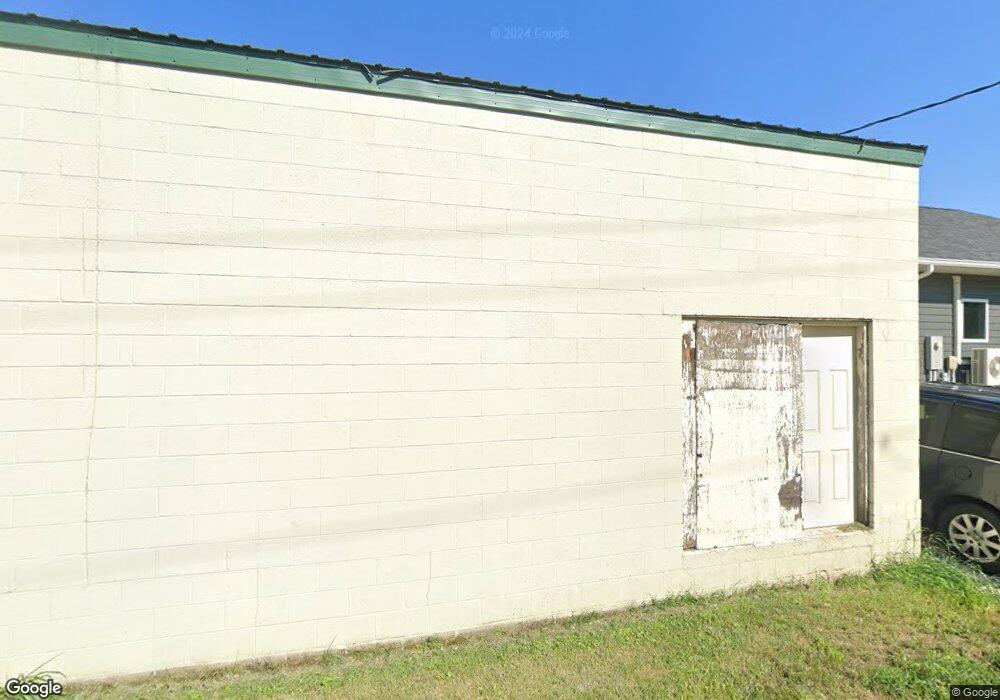
104 N Main St Marcus, IA 51035
Estimated Value: $143,000 - $175,914
2
Beds
2
Baths
1,016
Sq Ft
$159/Sq Ft
Est. Value
About This Home
This home is located at 104 N Main St, Marcus, IA 51035 and is currently estimated at $161,729, approximately $159 per square foot. 104 N Main St is a home located in Cherokee County with nearby schools including MMCRU Marcus Elementary School and MMCRU High School.
Ownership History
Date
Name
Owned For
Owner Type
Purchase Details
Closed on
Jun 15, 2010
Sold by
Busse Lloyd and Busse Lucille
Bought by
Richardson Joel
Current Estimated Value
Home Financials for this Owner
Home Financials are based on the most recent Mortgage that was taken out on this home.
Original Mortgage
$22,500
Interest Rate
6%
Mortgage Type
Seller Take Back
Create a Home Valuation Report for This Property
The Home Valuation Report is an in-depth analysis detailing your home's value as well as a comparison with similar homes in the area
Home Values in the Area
Average Home Value in this Area
Purchase History
| Date | Buyer | Sale Price | Title Company |
|---|---|---|---|
| Richardson Joel | $25,000 | None Available | |
| Richardson Joel | $25,000 | None Available |
Source: Public Records
Mortgage History
| Date | Status | Borrower | Loan Amount |
|---|---|---|---|
| Previous Owner | Richardson Joel | $22,500 |
Source: Public Records
Tax History Compared to Growth
Tax History
| Year | Tax Paid | Tax Assessment Tax Assessment Total Assessment is a certain percentage of the fair market value that is determined by local assessors to be the total taxable value of land and additions on the property. | Land | Improvement |
|---|---|---|---|---|
| 2025 | $1,730 | $143,580 | $11,130 | $132,450 |
| 2024 | $1,730 | $133,100 | $11,130 | $121,970 |
| 2023 | $470 | $133,100 | $11,130 | $121,970 |
| 2022 | $418 | $34,250 | $7,650 | $26,600 |
| 2021 | $418 | $34,250 | $7,650 | $26,600 |
| 2020 | $408 | $34,250 | $7,650 | $26,600 |
| 2019 | $422 | $34,250 | $0 | $0 |
| 2018 | $338 | $29,295 | $0 | $0 |
| 2017 | $348 | $29,295 | $0 | $0 |
| 2016 | $354 | $29,295 | $0 | $0 |
| 2015 | $300 | $25,038 | $0 | $0 |
| 2014 | $296 | $25,038 | $0 | $0 |
Source: Public Records
Map
Nearby Homes