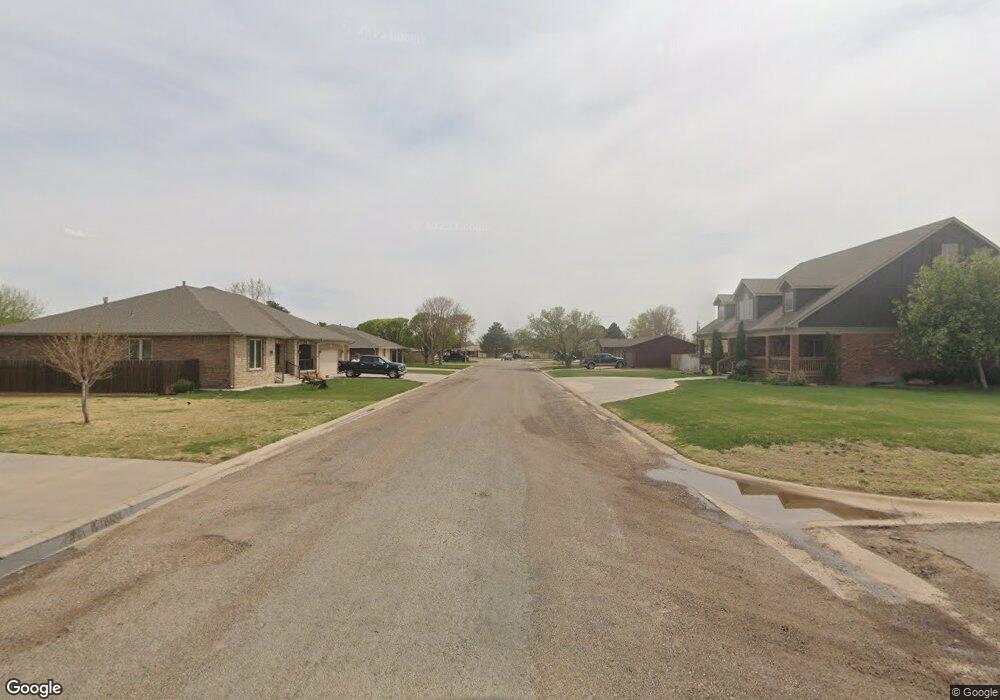
104 N Pershing St Hooker, OK 73945
Estimated Value: $100,000 - $186,000
3
Beds
2
Baths
1,512
Sq Ft
$93/Sq Ft
Est. Value
About This Home
This home is located at 104 N Pershing St, Hooker, OK 73945 and is currently estimated at $140,155, approximately $92 per square foot. 104 N Pershing St is a home located in Texas County with nearby schools including Hooker Elementary School and Hooker High School.
Ownership History
Date
Name
Owned For
Owner Type
Purchase Details
Closed on
Jun 24, 1997
Sold by
Longest Billy C
Current Estimated Value
Create a Home Valuation Report for This Property
The Home Valuation Report is an in-depth analysis detailing your home's value as well as a comparison with similar homes in the area
Purchase History
| Date | Buyer | Sale Price | Title Company |
|---|---|---|---|
| -- | $60,000 | -- |
Source: Public Records
Tax History
| Year | Tax Paid | Tax Assessment Tax Assessment Total Assessment is a certain percentage of the fair market value that is determined by local assessors to be the total taxable value of land and additions on the property. | Land | Improvement |
|---|---|---|---|---|
| 2025 | $370 | $7,457 | $691 | $6,766 |
| 2024 | $346 | $7,029 | $651 | $6,378 |
| 2023 | $334 | $6,824 | $598 | $6,226 |
| 2022 | $347 | $6,626 | $527 | $6,099 |
| 2021 | $335 | $6,626 | $527 | $6,099 |
| 2020 | $323 | $6,245 | $390 | $5,855 |
| 2019 | $317 | $6,063 | $390 | $5,673 |
| 2018 | $307 | $5,887 | $390 | $5,497 |
| 2017 | $271 | $5,715 | $390 | $5,325 |
| 2016 | $253 | $5,549 | $390 | $5,159 |
| 2015 | -- | $5,549 | $390 | $5,159 |
| 2014 | -- | $5,549 | $390 | $5,159 |
Source: Public Records
Map
Nearby Homes
- 206 N Memorial
- 706 W Park
- 212 Lorenz St
- 201 Glaydas St Unit aka Main Street
- Sect 27, TS 6 NW Nr 16
- 0 Mile 44 Rd Unit 20968945
- 4733 Road E
- 3012 Road S
- 808 E Indiana
- 604 Indiana St
- 422 Blackmer St
- 3076 Road P
- Lots 19 Rimrock
- 901 O Hwy N Hwy 54
- 09-02N-16E S E Mile 39
- 01-02N-15E S1/2 E Mile 35
- 412 & 207 E Hwy 207 & Hwy 412
- 6263 Meadows Ln
- 507 5th St
- 0 Road X
- 401 S Perkins Ave
- 405 N Pershing
- 409 N Pershing
- 403 N Pershing
- 404 N Pershing St
- 413 N Pershing
- 401 N Pershing St
- 402 N Pershing
- 313 N Pershing St
- 509 Phillip Cir
- 203 N Lorenz St
- 804 N Lorenz Dr
- 320 N Pershing St
- 120 Lorenz St
- 319 N Memorial Dr
- 317 N Memorial Dr
- 318 N Pershing
- 119 N Lorenz St
- 120 N Memorial St
Your Personal Tour Guide
Ask me questions while you tour the home.