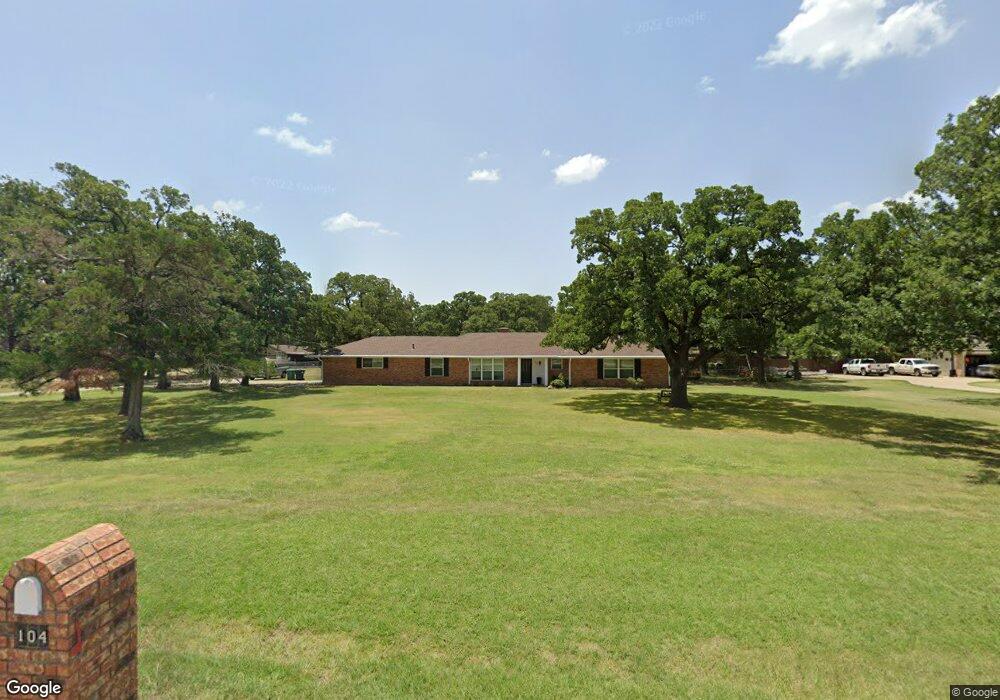
104 Old Alton Dr Denton, TX 76210
South Denton NeighborhoodEstimated Value: $433,000 - $551,000
3
Beds
2
Baths
2,022
Sq Ft
$238/Sq Ft
Est. Value
About This Home
This home is located at 104 Old Alton Dr, Denton, TX 76210 and is currently estimated at $480,408, approximately $237 per square foot. 104 Old Alton Dr is a home located in Denton County with nearby schools including McNair Elementary School, Harpool Middle School, and Guyer High School.
Ownership History
Date
Name
Owned For
Owner Type
Purchase Details
Closed on
Feb 24, 2017
Sold by
Bean Christopher D and Bean Lisa K
Bought by
Morel Christine M and Morel Robert J
Current Estimated Value
Home Financials for this Owner
Home Financials are based on the most recent Mortgage that was taken out on this home.
Original Mortgage
$259,920
Outstanding Balance
$214,198
Interest Rate
4.12%
Mortgage Type
New Conventional
Estimated Equity
$266,210
Purchase Details
Closed on
Nov 12, 1999
Sold by
Newman Darrell
Bought by
Bean Christopher D and Bean Lisa K
Home Financials for this Owner
Home Financials are based on the most recent Mortgage that was taken out on this home.
Original Mortgage
$164,350
Interest Rate
7.73%
Purchase Details
Closed on
Jan 13, 1994
Sold by
Howes David E and Howes Linda L
Bought by
Newman Darrell
Create a Home Valuation Report for This Property
The Home Valuation Report is an in-depth analysis detailing your home's value as well as a comparison with similar homes in the area
Home Values in the Area
Average Home Value in this Area
Purchase History
| Date | Buyer | Sale Price | Title Company |
|---|---|---|---|
| Morel Christine M | -- | Providence Title Company | |
| Bean Christopher D | -- | -- | |
| Newman Darrell | -- | -- | |
| Newman Darrell | -- | -- |
Source: Public Records
Mortgage History
| Date | Status | Borrower | Loan Amount |
|---|---|---|---|
| Open | Morel Christine M | $259,920 | |
| Previous Owner | Bean Christopher D | $164,350 |
Source: Public Records
Tax History Compared to Growth
Tax History
| Year | Tax Paid | Tax Assessment Tax Assessment Total Assessment is a certain percentage of the fair market value that is determined by local assessors to be the total taxable value of land and additions on the property. | Land | Improvement |
|---|---|---|---|---|
| 2025 | $5,034 | $501,829 | $134,800 | $367,029 |
| 2024 | $6,200 | $461,039 | $0 | $0 |
| 2023 | $4,326 | $407,405 | $134,800 | $305,528 |
| 2022 | $5,809 | $371,856 | $134,800 | $269,188 |
| 2021 | $5,543 | $339,539 | $80,880 | $258,659 |
| 2020 | $5,806 | $342,458 | $80,880 | $261,578 |
| 2019 | $6,038 | $342,011 | $80,880 | $261,131 |
| 2018 | $5,776 | $324,900 | $80,880 | $244,020 |
| 2017 | $4,966 | $277,662 | $80,880 | $196,782 |
| 2016 | $3,513 | $196,459 | $48,528 | $147,931 |
| 2015 | $2,985 | $185,631 | $48,528 | $137,103 |
| 2014 | $2,985 | $177,473 | $48,528 | $128,945 |
| 2013 | -- | $172,866 | $48,528 | $124,338 |
Source: Public Records
Map
Nearby Homes
- 8204 Montecito Dr
- 2912 Lighthouse Dr
- 2067 Leatherwood Ln
- 5029 Coral Cove
- 1569 Stanford Ct
- 8813 Swan Park Dr
- 2109 Doecrest Dr
- 8704 Serenity Way
- 7912 Hidden Path Ln
- 2901 Saddle Dr
- 8404 Glen Falls Ln
- 7804 Hidden Path Ln
- 2727 Catoosa Ln
- 2614 Dakota Cir
- 7301 Chaucer Dr
- 6509 Wellston Ln
- 1612 Marble Cove Ln
- 7305 Mira Vista Dr
- 6828 Crenshaw Ln
- 7100 Frost Ln
- 106 Old Alton Dr
- 102 Old Alton Dr
- 103 Old Alton Dr
- 105 Old Alton Dr
- 101 Old Alton Dr
- 108 Old Alton Dr
- 110 Old Alton Dr
- 2700 Cedar Creek Ln
- 2700 Cedar Creek Ln
- 3600 Cedar Creek Ln
- 109 Old Alton Dr
- 109 Old Alton Dr
- 8312 Montecito Dr
- 8316 Montecito Dr
- 8320 Montecito Dr
- 8304 Montecito Dr
- 8324 Montecito Dr
- 8300 Montecito Dr
- 8328 Montecito Dr
- 8228 Montecito Dr